
Customized reports offer flexibility in deciding what data to include in a report and how to display the data. In addition to formatting standard lists and using reports defined by the system, you can define and run your own custom reports. You can also edit the defined report definitions to tailor them to your needs. When you create your own reports, you can...
Before you start, it is important to know this:
Reports that you output in .pdf are OCR enabled. This means that you can use the .pdf search
to locate information in a long report. This feature is extremely handy when you have a very large report,
and wish to locate a single piece of data.
Custom reports are fully integrated with the system's security settings.
A user's ability to view, create, edit, or delete a report definition is controlled by the role object "Reports."
The objective is to allow Materials, AP, and GL managers to have more control over report quality so that only users authorized to create or change report definitions can access those features.
The role object “Reports” provides user access to the features in My Report Definitions and Standard Report Definitions. (Materials Management, AP, or GL main Contents > Reports)
For the “Reports” role object, settings result in the following restrictions/capabilities for users.
| “Reports” Role Object Setting | Affect on User Capabilities |
None |
The options “My Report Definitions” and “Standard Report Definitions” are not visible to the user on the Reports menu. The user cannot view report definitions at all. |
View |
The options “My Report Definitions” and “Standard Report Definitions” are visible on the Reports menu. |
Modify |
The options “My Report Definitions” and “Standard Report Definitions” are visible on the Reports menu. The user can also: |
Create |
The user has all the capabilities allowed in Modify. |
All |
The user can create, edit, modify, or delete a report definition. |
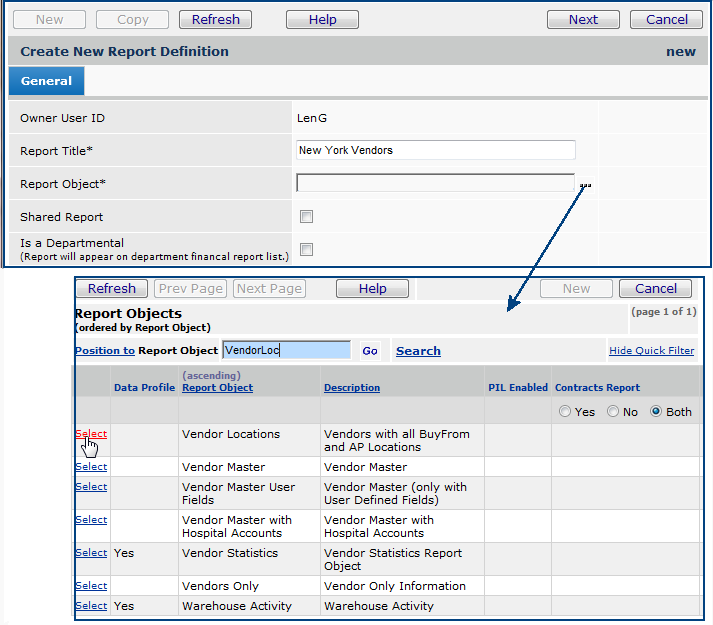
Custom reports are implemented using report objects. A report object is a logical view into the database -- it contains data from various related database tables. A user's ability to create, run, and/or view specific reports based on their report objects depends on whether a Report Profile is assigned to the system User ID; and if so, which Report Profile. A Report Profile limits the report report objects that a user can access, so that not all users at a site may be authorized for all reports. A site's system administrator can permit or restrict viewing and / or report creation among users at a site. If you need access to custom reports, see your site's system administrator.
Many report objects are restricted by data profile. For those report objects, only data for departments and organizations allowed in the user's data profile can be accessed. Report objects restricted by data profile contain "Yes" in the Data Profile column on the Report Objects list.
Several modules on the Training menu will help you work with reports. Figure 1 displays the reports training lessons.
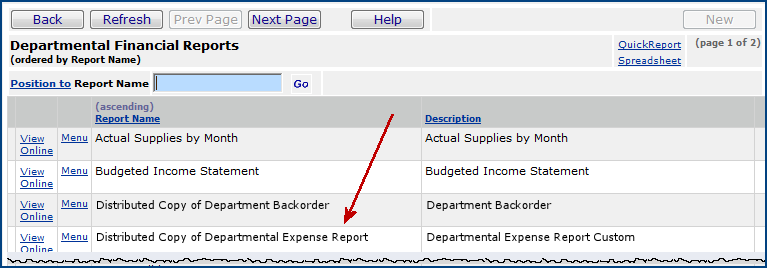
From the main Contents, select Reports >
My Report Definitions. The list of custom reports appears (Figure 2), if any have been created by users at your site.
If there are no reports, No Data appears. (In Figure 2, Quick Filters are hidden.)
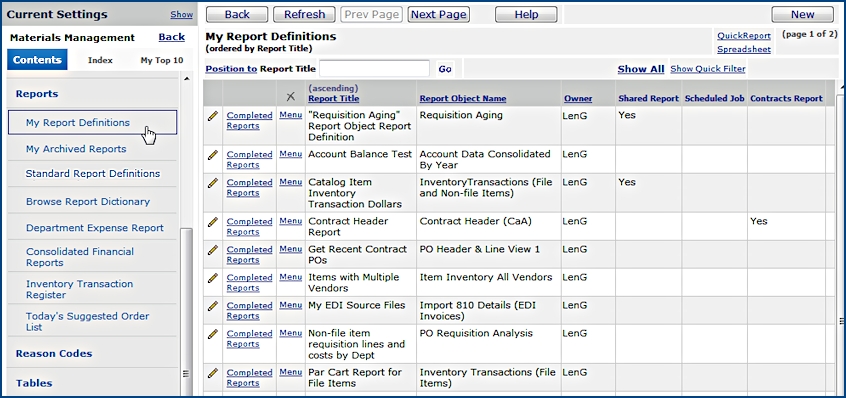
From Menu next to any report definition on the list, you can print a report, schedule a report to run, view reports that have run, edit the report definition, delete the report definition, and more. Clicking New lets you create a new report definition.
See Setting up scheduled jobs for details on how to use the job scheduler to run your reports on specific days/times.
Hint
You may wish to leave your report unshared while you are
working on it. When you have the report definition finished, you can edit
it to select the Shared Report box.
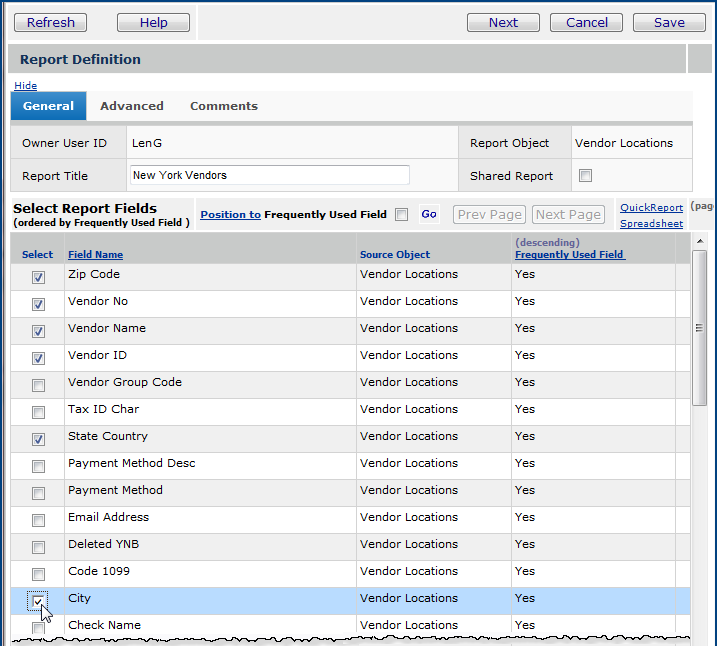
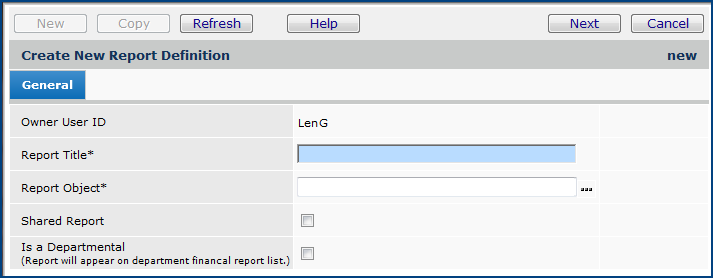
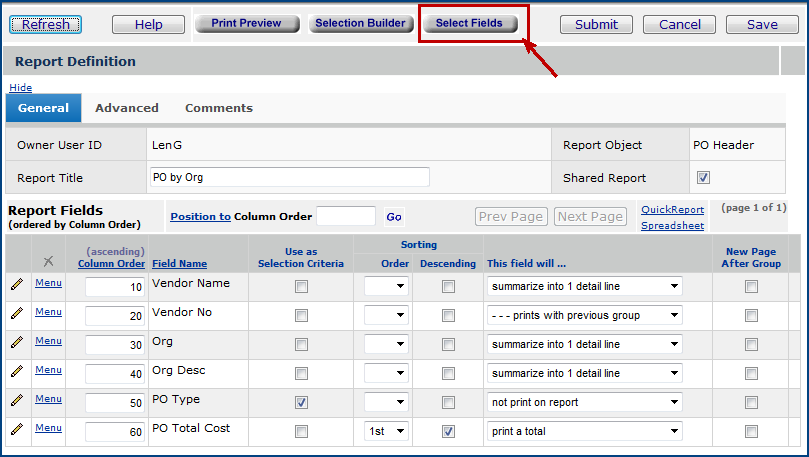
The Select Report Fields list contains all the fields that you may include in your report.

The General tab contains the Report Title and the Shared Report selector.
The Advanced tab (Figure 12) lets you define your report's output type. The Comments tab is a place for you to annotate your report.
The Report Fields edit panel lets you order your fields and configure your report.
- If you need to add more fields to your report, click Select Fields. The system again displays fields for you to select.
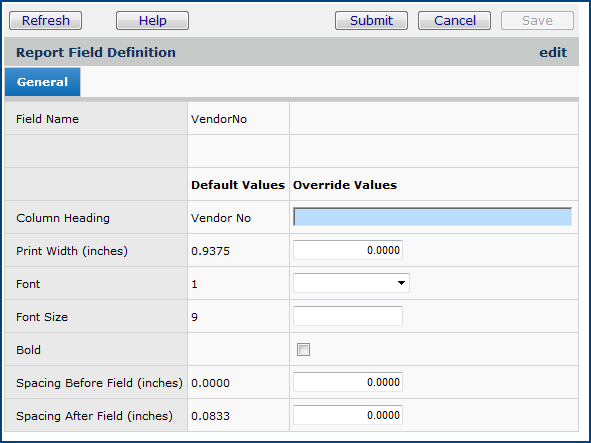
You can enter a new column heading label and column width, specify a font and font size, and other options.
- Click Help for details on the values you can enter.
- Click Save to save your work.
- Click Submit when you are finished.
The system closes the window and applies the designated formatting to the field. The changes you made take effect during the next report run.
Ordering
the report columns
Column Order tells the system how to order the columns in a report.
A whole number appears in the Column Order space next to each Field
Name. The number specifies the column placement in relation to the other
columns (left to right) in the report. The columns for the report are listed
by tens (10, 20, 30, etc.) instead of by ones (1, 2, 3, etc.). This numbering
scheme lets you reorder columns without having to renumber all of them.
For instance, you may want the second field in the Field Name list
(Figure 6) to become the fourth column in the report.
In this case, assign the second field a column order between 50 and 60;
for example, 55.
- Click Save periodically to save your work.
- Click Refresh (after clicking Save) to see the fields rearranged
in the order you specified. (If you open the Report Definition again for
editing, the order sequence interval will be 10.)
- Click Print Preview at any time while designing a report to see
how the columns are going to look.
Identifying
a field as a filter
You may wish to create a report containing data that are specific for a
department, item class, vendor, or some other criterion -- in other words
-- to set up a filter for users of the report. To designate a field
on your report as a filter, check the box under Use as Selection Criteria
for the field (Figure 6).
When users run the report, the system prompts them for a value for the filter
field(s). For example, if you check the Use as Selection Criteria box
next to State Country (red arrow in (Figure 6),
the system asks for the State for the vendors before it runs the report.
Specifying
sortable columns
You may need to sort the report by the values in one or more of its
columns. To designate a column as sortable, select a rank from the drop
box under Order By (Figure 6). If your
report should sort by only one column, under Order By, select 1st
next to the field name.
For example, if your report contains dates, you could designate the date
field as a sort field. Users could then sort the report information in ascending
order, with the earliest date first; or in descending order, starting with
the latest date. Similarly, it may be logical to sort by item number, department
number, vendor name, or other fields. You may wish to use multiple sort
fields; for example, if you are reporting usage information, the report
could sort first by date (1st), and then by item number within each
date (2nd).If you select a field as a grouping field (see the discussion
of grouping fields), do not assign it a sort order.
Descending
Select the Descending box (Figure 6) if you want
the sortable report field to sort in descending order. (The default is ascending
order.)
This field
will... (Produces column totals and groups)
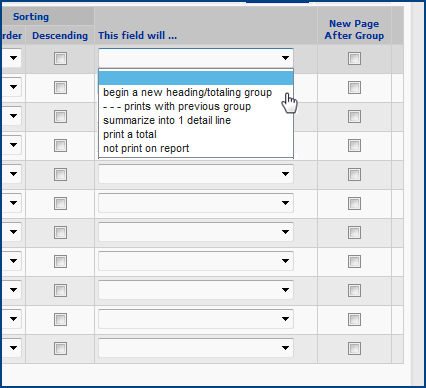
This field will... (Figure 6) contains selections
that group data and calculate column totals. For a column that contains numeric
data -- data that you can add and subtract -- the system generates a total.
For non-numeric data, the system generates a count. Figure 8 displays the values
in the This field will... drop box.
Note: This field will... is important in creating summary reports.
Creating Summary Reports contains details.
Use the values in the drop box to identify the classification or grouping fields in your report, and the fields that you want to total. For example, suppose you are creating a report that shows how much each department spends on stock and non-stock items for a given month. The data you have in mind for the report looks like Figure 9:
Note: Another example that uses grouping fields is in Creating Summary Reports: Grouping Data .
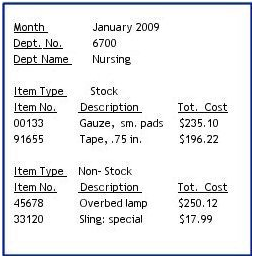
You want data by department, and by item type: stock or non-stock. Your report will have fields for the Month (selectable), Department Number, Department Name, Item Number, Item Description, Item Type, and probably the Total Cost to the department for each item. Your grouping fields are Department Number and Item Type. You want separate data for items of each type and each department. Your totaling field is Total Cost.
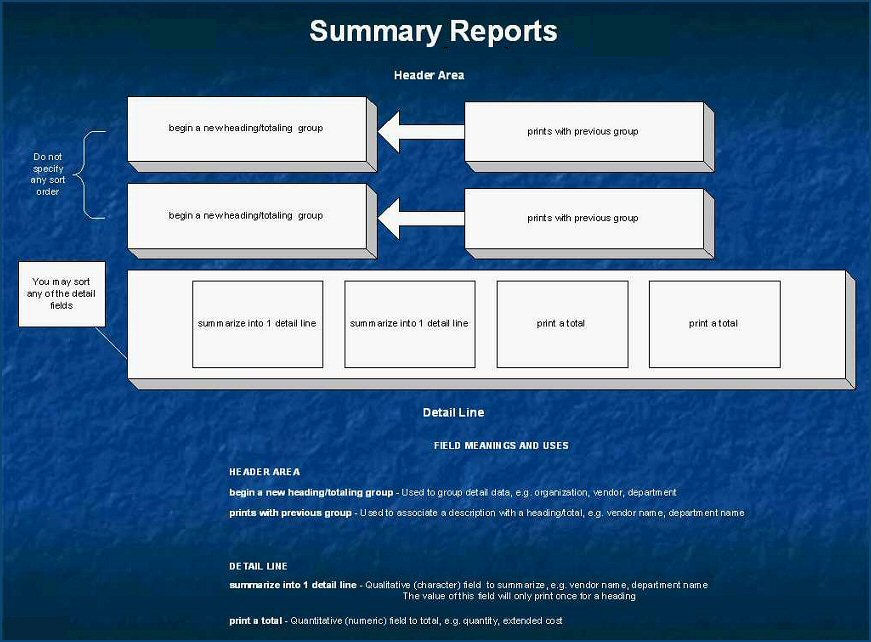
Selections shown in Figure 8 are:begin a new heading or totaling group - Select this value when your field is a grouping or classification field. In Figure 9, you would select this value for Department No and Item Type. A field with this value selected should not have a Sorting Order assigned. (See Creating Summary Reports.)
prints with previous group - Select this value if the field belongs with another field. For example (Figure 9), you would select this value for Dept Name.
summarize into 1 detail line - This value "collapses" several lines on your report into one line. For example, with Item Type (Figure 9), perhaps you only want to see one line in the report that shows the cost for all stock items and a line for all non-stock items. You don't want to see each individual item listed. In that case, select this value for the Item Type field. (Also, see Creating Summary Reports for examples.)
print a total - This value identifies any field that you wish to total. In the Figure 9, you would select this value for the Total Cost field. The application also generates Grand Totals in the report. (See Creating Summary Reports.)
not print on report - If you do not want a field to actually print on the report (but you do want the report to use data from the field), select this value.
For the report that we defined in Figure 2, the Report Definition, so far, looks like Figure 10:

Notice the following:
- State Country is a selection field, and also defines a group.
- Within the State Country group, the data will be sorted in ascending order -- first, by Vendor Name, and then by Vendor ID.
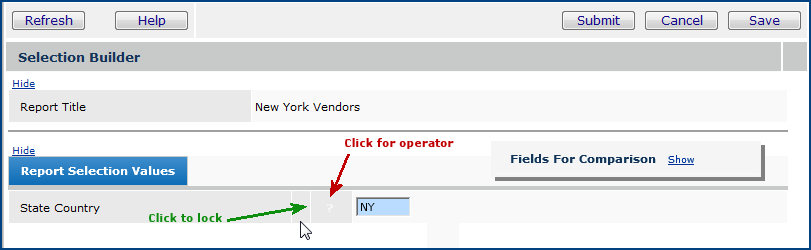
You can also enter operators (in the list below). Hold the mouse over the box to the immediate left of the selection value (Figure 11, red arrow). A question mark ? appears. Click the question mark repeatedly to locate and set the operator as you wish. The operators are:
GT - greater than
LT - less than
EQ - equal to
NE - not equal to
GE - greater than or equal to
LE - less than or equal to
Like - match a set of characters. For example, if your site has Clinic A, Clinic B, Clinic C, etc., specifying "clinic" with like will select all the clinics.
You can enter the characters that you want to match directly in the box, or click the arrow to select a value (if there is one) that you want to match. Like is not case sensitive, so it will match a character to both upper- and lower-case occurrences of the same character.
Range - a range of values
List - lists possible values.Figure 12A and Figure 12B display sample results for a date field when different operators, and NE are used.
In the figures, assume that the current date is July 28, 2015...the date when the user is running the report.
Figure 12A - Sample Results of Using the Various Operators with Date Fields
Figure 12B - Sample Results of Using the "NE" Operator with Date Fields
- If you wish to compare the field to another field, choose an operator, and click Show on the Fields for Comparison box. A list of selectable comparison fields appears.
- Once you set up one or more selection values, you can lock them so that the report will always run for the values you specified. Click on the second box to the left of the selection value to lock or unlock a value (Figure 11, green arrow.)
- To let users specify a value for the selection field when they run the report, leave the selection fields blank.
- Click Help on the Selection Builder for detailed information about its fields, how to use operators, and create comparisons.
- Click Submit when you are finished entering selection field values.
The Report Definition panel reappears.


A summary report collapses detail lines into a single line that summarizes the data in the columns. The examples below illustrate how a summary report differs from a detail report, and how to set up a summary report.
Important: Before you read the paragraphs below about summary reports, make sure that you understand the preceding sections on how to create custom reports in general.
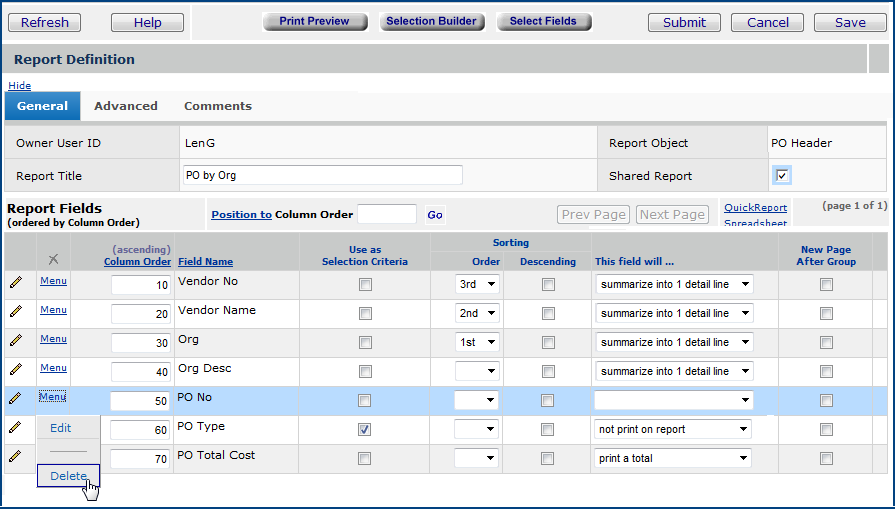
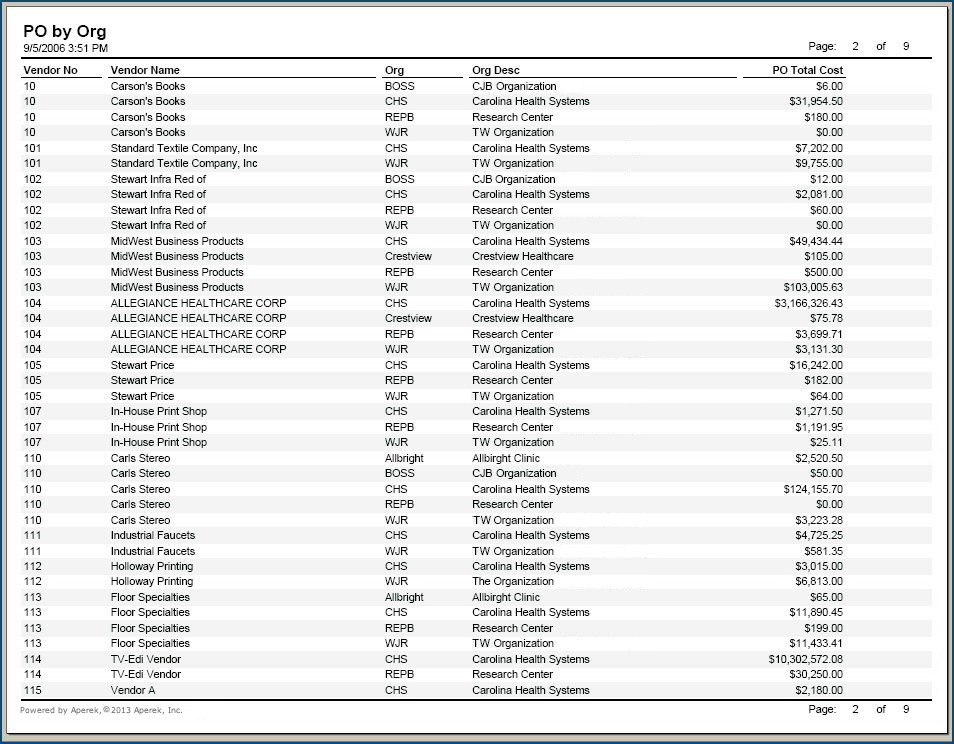
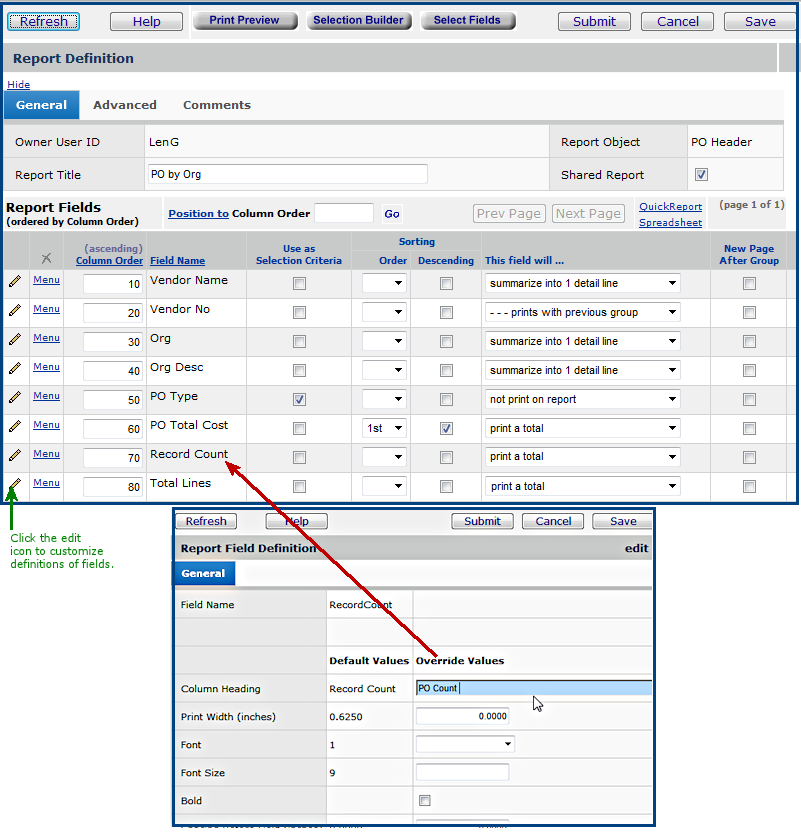
Figure 16 shows a report definition for a regular, detail report called "PO by Org." Notice that the columns are ordered by Org, then by Vendor Name and Vendor No. One field, PO Type, is a selection field that does not actually print on the report.

A page from the printed output for the report is in Figure 17. Notice that this output continues for 200 pages, with information about every PO for every vendor by organization. In its current form, this report is not very useful.
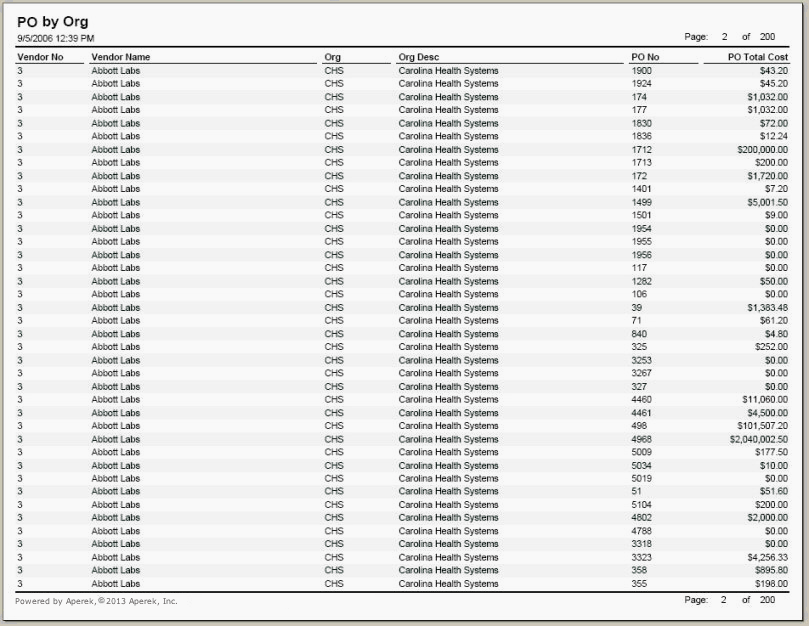
What we really need is a report that provides a summary, for each organization, of PO dollar totals and the number of POs by vendor.
For a summary report, instructions on handling the PO header information and the PO line information must be entered under "This field will..." in the report definition for each column. The instructions (illustrated in Figure 18) are:
| Entries for "This field will..." on a PO Summary Report Definition | |
| For the PO header information: | For the PO lines: |
| begin a new heading/totaling group | summarize into 1 detail line |
| prints with previous group | print a total |
With "This field will..." instructions entered for the summary columns, the Report Definition panel looks like Figure 19.
For each different value of the first four fields (Vendor No, Vendor Name, Org and Org Desc), a line is printed on the report that displays the PO Total Cost. In other words, the instructions ("summarize into 1 detail line") for the top four fields and for PO Total Cost ("print a total") collapse multiple purchase orders for each vendor and organization into a single purchase order total.
The PO Type field is a selection field used to create the report, but is not printed.
Notice that the field PO No is being deleted from the report definition. The PO No field is a text field that cannot be summarized or collapsed, since each purchase order has a unique PO Number. This field cannot contribute anything to the summary report (nor could the report run correctly if it is included), so it is deleted.
For the columns with the instruction "begin a new heading/totaling group," sort order cannot be specified. Columns with "summarize into 1 detail line" can have a sort order specified.
Important: You must enter an instruction for every column in the report under "This field will..." Blank values will produce incorrect results for summary reports.
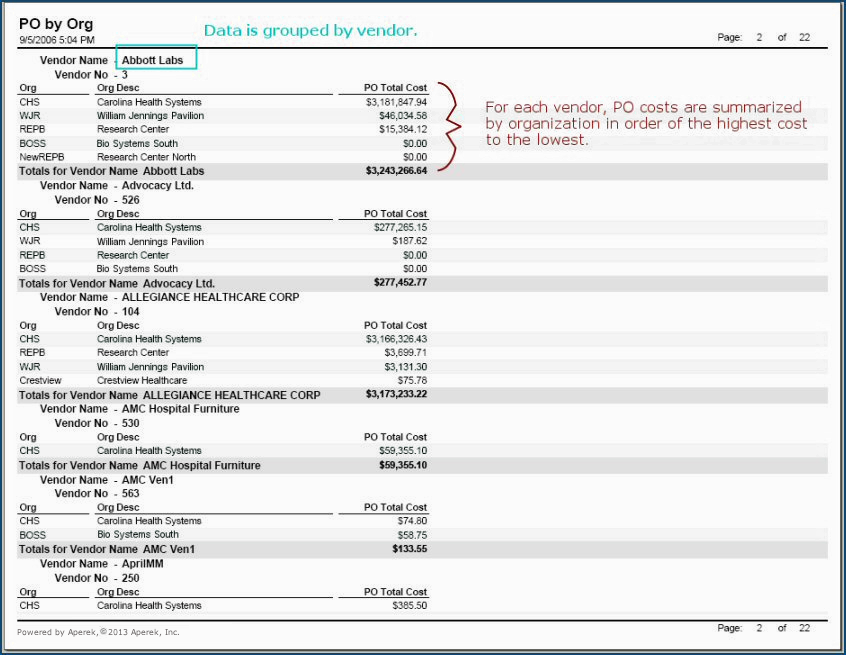
Running the report definition from Figure 19 produces the output displayed in Figure 20. For each vendor and organization, the total cost of purchase orders is summarized.
This nine-page summary report is a big improvement over the 200-page detailed report from Figure 16. However, we can refine the report definition even further to summarize the data even better.
Figure 21 shows changes in the report definition that result in a report where summary data is grouped by vendor.

Under "This field will...", Vendor Name has the instruction "begin a new heading/totaling field." This instruction groups the data (that is, the PO cost totals) by vendor name. Vendor No prints with Vendor Name, so that Vendor No is no longer a separate column, but instead, is part of the group heading. Also, the column order has changed so that Vendor Name prints before Vendor No.
The PO Total Cost field is defined as a sort field and sorts first. (Previously, Org was the field that sorted first.) Within each group, PO Total Cost is ordered by organization, starting with the organization that has the highest PO Total Cost dollars, and descending to the lowest. (Figure 22).
The Total Lines field is supplied with the "PO Header" report object. Total Lines provides the total number of lines in a purchase order.
The Record Count field is available for every report object. This field records the number of summarized records; that is, the number of row data records that would occur on the report if the rows were not collapsed and summarized.
To use these fields, edit the report definition and click Select Fields (Figure 23)
 .
.
The list of fields appears (Figure 24).
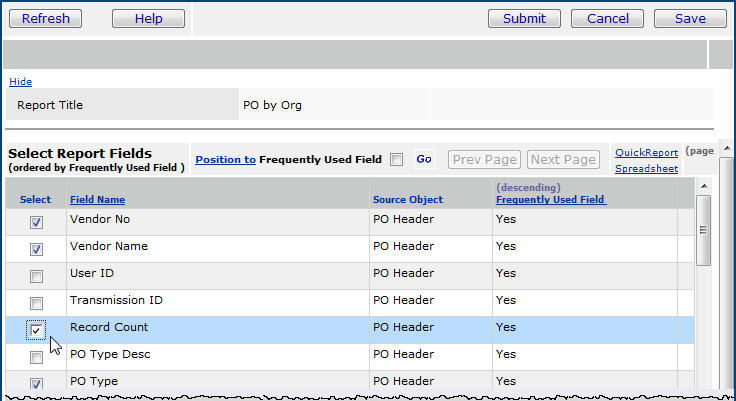
Scroll the list to locate and select Record Count and Total Lines. Click Save then Submit to return to the report definition. When you refresh the report definition (by clicking Refresh), the Record Count and Total Lines fields appear.
Figure 25 is the revised report definition that includes the Record Count and Total Lines fields. Record Count is re-labeled so that it will appear on the report as "PO Count" since the number of records for any vendor will, in fact, be the number of purchase orders. Note that the previous instructions under "This field will..." have been changed from groupings to regular summary lines. The sort order by PO Total Cost remains so that the report sorts with the highest dollar amount at the top, in descending order.
The printed output for the report definition is in Figure 26.
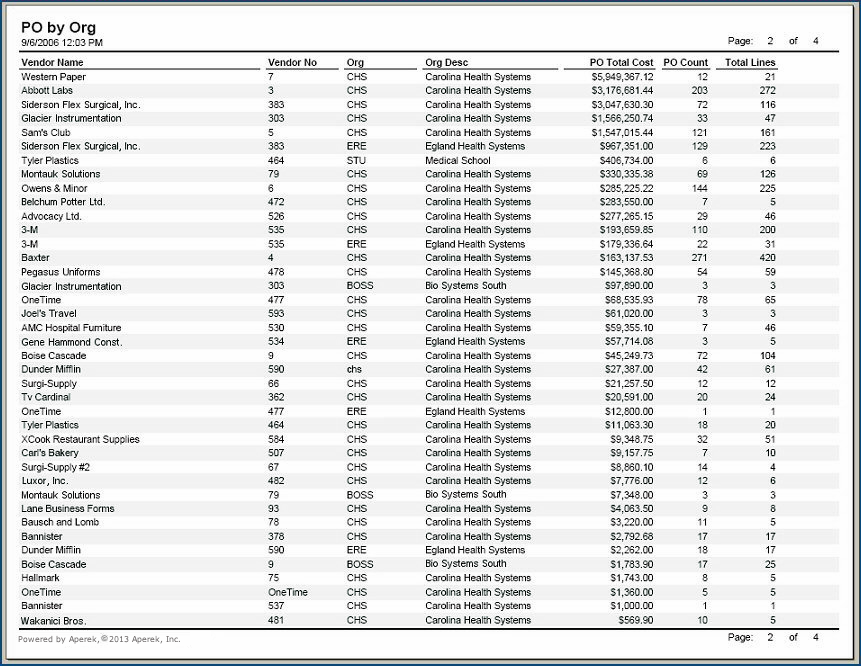
The PO Total Cost column contains the total purchase order amount for each vendor for each organization. The PO Count column (which is the Record Count column renamed) is the total number of purchase orders for the vendor/organization. Total Lines is the total number of purchase order lines.
If you wish to perform detailed analysis with a report, a useful strategy is to output the report as an Excel spreadsheet, and then use Excel's tools, such as filters (to filter and rank column data) and formulas (to manipulate mathematical data).
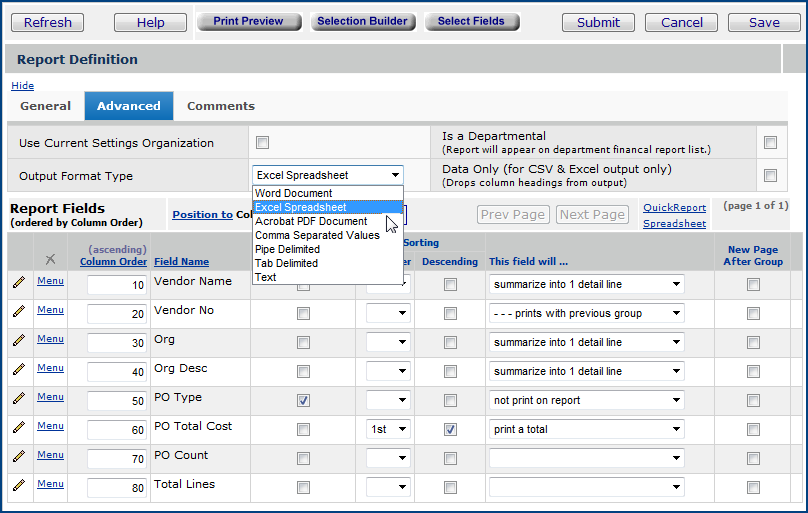
Figure 28 is the Excel spreadsheet output for the report defined in Figure 25.
Notice that you can select the Excel AutoFilter capability from the Data menu. AutoFilter inserts a filter selection button ![]() (indicated by the red arrow) at the top of each data column. Click the
(indicated by the red arrow) at the top of each data column. Click the ![]() button to view and select a filter for the column. When you select the filter, Excel displays the data filtered as you specified.
button to view and select a filter for the column. When you select the filter, Excel displays the data filtered as you specified.
To view the spreadsheet as it originally appeared, without being filtered, select Tools > Filter > AutoFilter again to turn off the AutoFilter..

Several date fields are stored internally as "date plus timestamp." For this reason, entering the date alone will not return the information that you may want associated with the date. The most common date fields that contain timestamps are:
- CreateDate
- LastUsedDate
- DeletedDate
- Transaction TS
- AuthorizedDateTS (in the "PO Header Line View 1" report).
To get information for a single date, enter date values as a Range, with the same date in both fields of the range; for example (Figure 29):
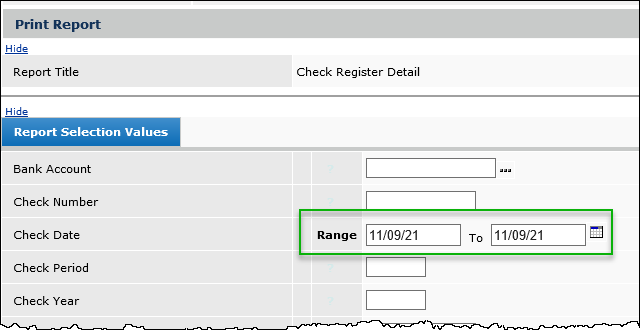
This date specification is the same as asking for data from the beginning of the day at 12 AM to the end of the day at 12 PM, and avoids any timestamp that might occur in the data.
If you leave a quantity or currency field blank, ERP assumes that you want to see all quantities/prices/costs. When you actually want to see data where a quantity or price/cost is zero, for integer values, use: Qty < 1. This works because positive integer fields cannot have values between 0 and 1. For currency fields use three or four decimal places, as appropriate. For example, searching for a Unit Cost of 0 requires using < .0001 since unit costs are four decimal places. Extended Cost is only 2 decimal places and requires < .01
ERP uses an ASCII sorting sequence for characters in which some characters (e.g., all letters) have a "higher value" than other characters, such as *.
- To search for a text value that is non-null, use GE *. This specifies that you want all text values that are "greater than or equal to" *, meaning all text characters. get all text values
- Similarly, to search for missing text values, use LT*. Leaving the field blank instead of entering LT* will not produce the correct result because My Reports ignores any selection value that is blank.
(You can also use Range with the top value empty, and the bottom value set to * . See Figure 30.)
The figure also contains the list of ASCII text characters, so you can get a better idea of what we mean by the sorting sequence with some characters being "greater" than others.

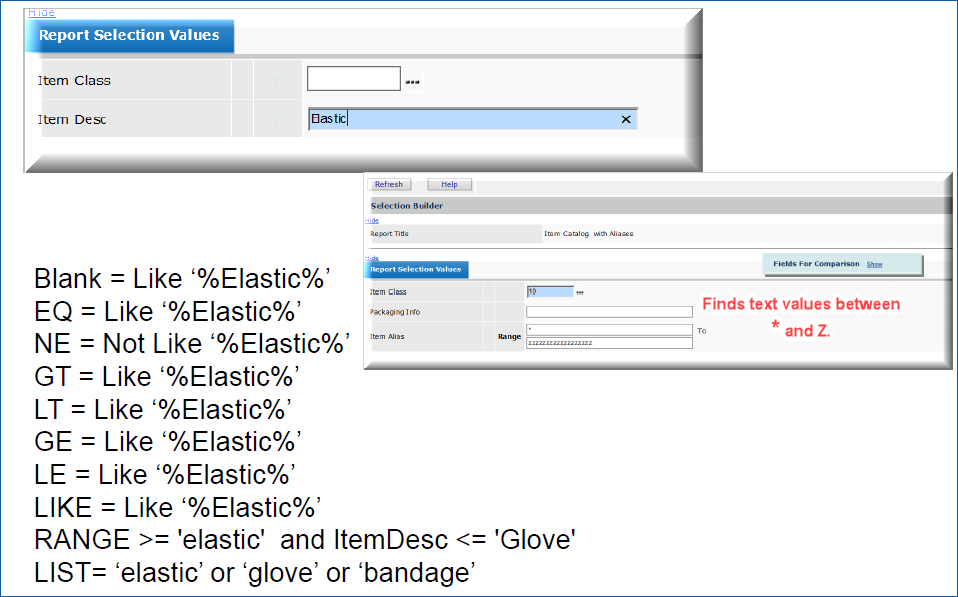
You can specify item description and item alias values in an Item Desc field using operators such as EQ, NE, etc.; Range and List. Figure 31 summarizes what the various operators mean when used with item description and item alias values. operators with text
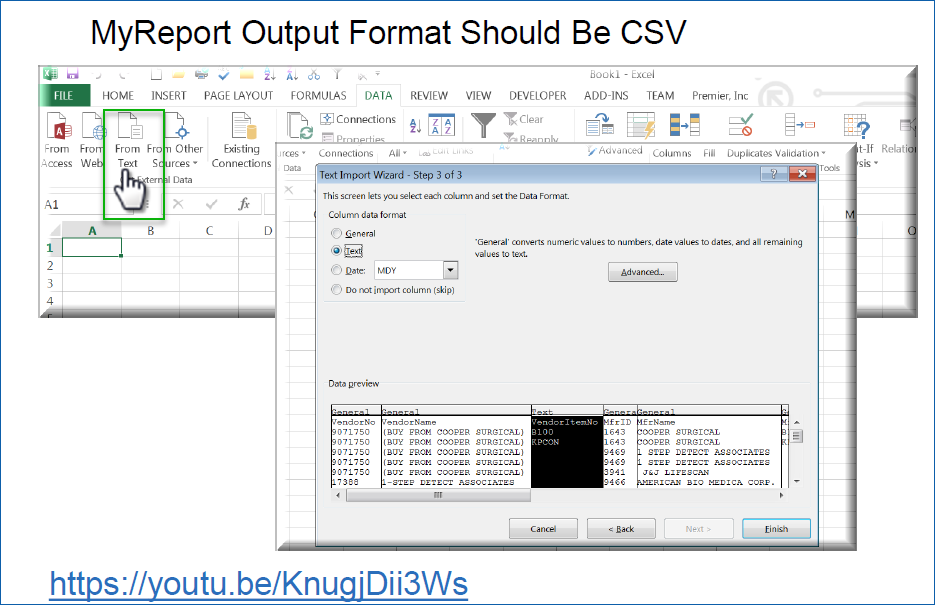
Currently, reports in Excel output are limited to 64K lines. You can work around this limitation by setting your output to .csv. (See Outputting reports in different file types.) You can then open your report with Excel.
This method, however, is not painless. Once your report is open in Excel (if you are using Excel 2019), you will need to convert some of your column types to text. The reason is, among other things,
that
Excel provides a text conversion wizard (Figure 32). Also, in the figure is the location of a You Tube video that goes through the process.
Copyright © 2022 by Premier Inc. All rights reserved.

