A financial report is a document that captures, structures, and summarizes general ledger account data for a given purpose. Examples of financial reports are income statements, cash flow statements, balance sheets, summary trial balance sheets, and other documents created for a hospital's particular needs. You can create, edit, and copy financial report definitions, run and output reports in several formats, and send the output to a printer.
This topic is a reference guide to Financial Report Writing. This topic contains several "how-to" sections, but it is not intended as primary training material. This topic has a companion document Financial Reports - Advanced Topics which describes stored row/column definitions, repeating a report run for different departments, overriding a defined account mask, and copying a report definition.
Users of the Financial Report Writer must have the role object General Ledger Report Writer set to Create as a minimum. The setting must be All if a user is both creating and deleting reports. The users' data profiles must include the appropriate organizations and departments.
ProSheet security has been aligned with users’ Data Profile settings.
Data Profile settings for allowed organizations and departments control the account data that you can access using the application's account inquiry, the Financial Report Writer, and ProSheet’s account retrieval and downloading functions. You can turn off data profile checking. Instructions are in the ProSheet Security section below.
You need to be aware of the following:
The organizations/departments whose account data you retrieve using Account Inquiry, the Financial Report Writer, custom reports, or ProSheet must all be included in your Data Profile. If organizations/departments are not included in your Data Profile…
- The downloaded data will be different than downloaded data that included the missing organizations/departments.
- The results of any calculations will be different.
This security also applies to account masks, and to account selection templates called in to ProSheet, account inquiry, or used with the Financial Report Writer. Accounts identified by a mask are not available if the organizations/departments “wildcarded” in the mask are not in your Data Profile.
You can restrict financial reports to specific organizations. You can also restrict account selection templates (see Using Account Templates) to particular organizations. Restricted account selection templates cannot be used to create custom financial reports, account inquiries, row/column definitions, and ProSheet reports by users who are not authorized for the relevant organizations (in Data Profile settings).
Make sure that your Data Profile contains the organizations/departments whose data you need to work with. If you need to have organizations/departments added to your Data Profile, contact your site’s System Administrator. For questions or problems, the Premier Solutions center is available.
By (optionally) restricting financial reports by organization, you can limit access to them based on users' data profiles.
When financial reports or selection templates have been restricted by organization, reports can only be displayed/edited by users with data profile access to at least one of the restricted organizations. This feature helps to avoid one organization accidentally reading or editing another's financial reports.
Restricting a financial report by organization is made up of two main sets of tasks:
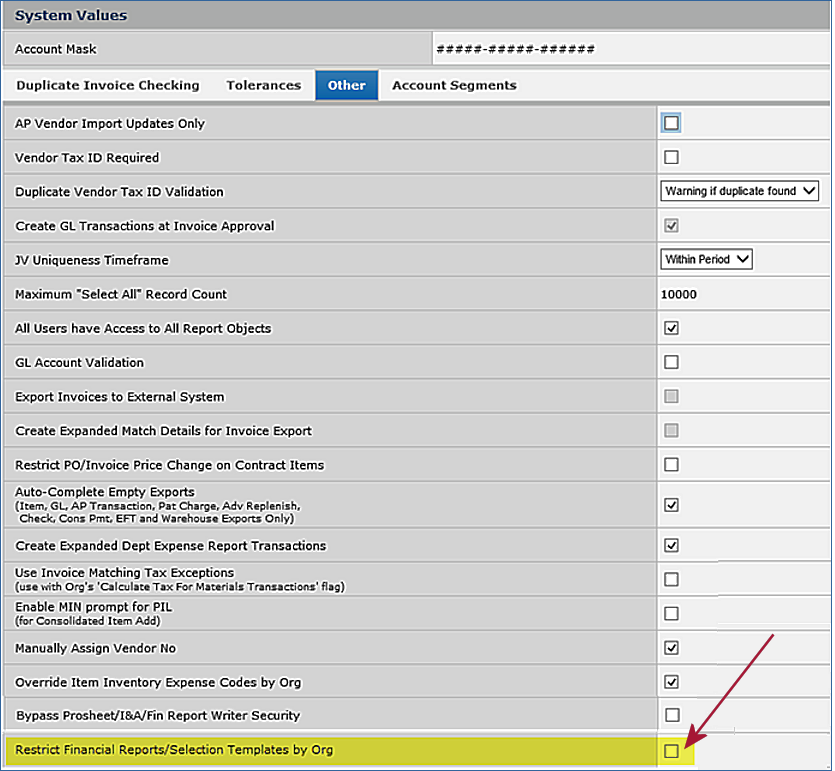
The initial setting for the Restrict Financial Reports... field is "off" — financial reports are not restricted. Once you enable the option, a warning message appears if a user tries to disable it. The warning states that existing restrictions will not be enforced when the flag is disabled.
Note: The ability to change the Restrict Financial Reports... field on the System Values Other tab is controlled by the role object "GLFINRptWtr". This role object must be set to All.
When the system value Restrict Financial Reports/Selection Templates by Org field is enabled:
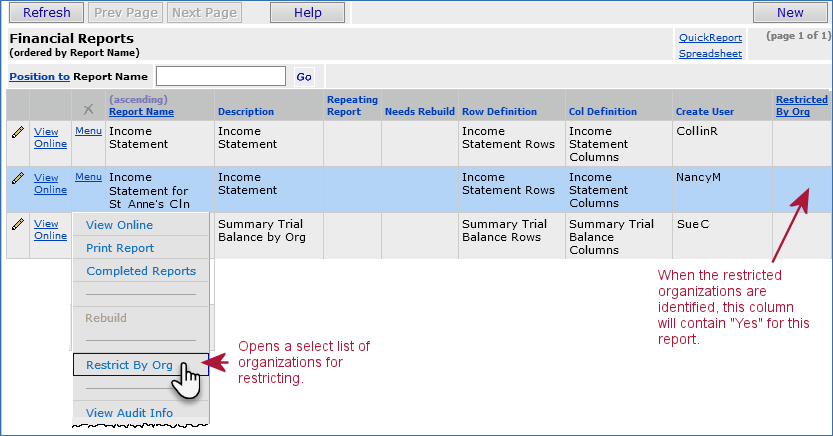
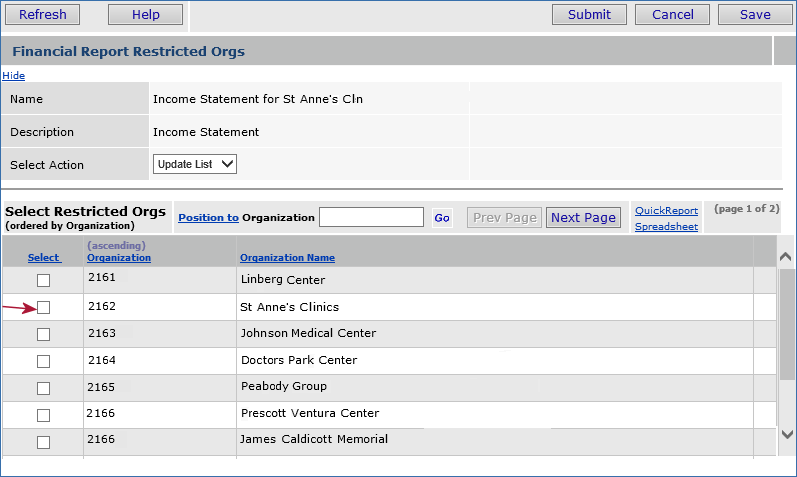
The Restrict By Org menu option opens a list of organizations already available to the user based on his/her data profile. From the list, you can select organizations that have access to the financial report. For example: In Figure 3, clicking the box next to 21620 – St. Anne's Clinics would only allow users with St. Anne's Clinics in their Data Profiles to access the report "Income Statement for St. Anne's Clinics." In contrast, a user logged in to ERP with the Current Settings of Organization set to 21610 would not be able to access the report because the report does not include 21610 as one of the restricted organizations.
Important: If you add additional organizations to a data profile, you must use this feature to restrict any of the necessary added organizations, even if you used Select All in your initial setup. Select All only marks the organizations that are currently in the target data profile when you use this feature. Adding new organizations to the Data Profile turns the restriction off.
Note on Consolidated Financial Reports: You can also restrict account selection templates by organization. Any consolidated financial report based on a restricted account selection template is only available to users with the organizations allowed by the restriction in their Data Profiles.
General Ledger provides several report-generating tools accessible from the main Contents:
Note: This topic describes how to use the Interactive Financial Report Writer and ProSheet to generate reports.
See Creating Custom Reports for information about report definitions supplied by the system (Figure 5) and how to customize them.
The method that you use to create a financial report depends on the type and quantity of data in the report, and on how the report is used.
ERP Financials use three types of report writers:
Table 1 has some questions that will guide you in deciding which report writer to use.
FRW |
ProSheet |
Ad Hoc |
||
1. |
Account selection using lists, ranges and wildcards by account segment |
Yes |
Yes |
Limited |
2. |
Access to Account Templates |
Yes |
Yes |
No |
3. |
Filtering by Account Class/Type |
Yes |
Yes |
If on Report Object |
4. |
Filtering and summarizing by account sub type |
No |
No |
If on Report Object |
5. |
Support for summary and detail rows |
Yes |
Yes |
Limited |
6. |
Formula support for calculated rows and columns |
Limited |
Yes |
Minimal |
7. |
Access to balance types for period, quarter, ytd, etc. |
Yes |
Yes |
No |
8. |
Reporting on actual and budget for multiple fiscal years within the same report |
Yes |
Yes |
No |
9. |
Application based report organization |
Yes |
No |
Yes |
10. |
Application based security and backup of reports |
Yes |
No |
Yes |
11. |
Well suited for building and processing summary reports |
Yes |
Yes |
Yes |
12. |
Well suited for building and processing detail reports |
Limited |
No |
Yes |
13. |
Reuse of existing row and column definitions |
Yes |
No |
No |
14. |
Repeating reports |
Yes |
No |
No |
15. |
Departmental report functionality based on Data Profiles |
Yes |
No |
Yes |
16. |
Suppression of zero rows |
Yes |
No |
Yes |
17. |
Drill down |
Yes |
Yes |
No |
18. |
Charting |
No |
Yes |
No |
19. |
Easy to copy existing reports |
? |
Yes |
Yes |
Common Financial Reports |
||||
1. |
Board Reports |
Yes |
Yes ++ |
No |
2. |
Internal Financial Statements |
Yes |
Yes |
No |
3. |
Summary Trial Balance |
Yes |
Yes |
Yes |
4. |
Detail Trial Balance |
Slow |
Slow |
Yes |
5. |
Departmental Reports |
Yes |
? |
Yes |
Other Financial Reports |
||||
1. |
Highly summarized balancing reports |
Yes |
Yes |
No |
2. |
Month end schedules |
Yes + |
Yes ++ |
Yes |
3. |
Transaction level schedules |
No |
No |
Yes |
4. |
Audit schedules |
Yes |
Yes + |
Yes |
5. |
Tax schedules |
Yes |
Yes + |
Yes |
The Financial Report Writer contains an interactive design panel -- the Report Writer Editor -- that lets you build and view the contents of your report. You can create row and column definitions on the fly using the Report Writer Editor. Also, you can establish and save standard definitions for row and column contents, and use the definitions over and over in different reports. Similarly, you can create standard account templates and masks to define particular accounts that you want to report on, and use the templates in various reports.
To get the most out of this topic, you need to be familiar with your hospital's Chart of Accounts and the various financial reporting needs of different organizations at your hospital. If you have ever written custom report definitions in the system for other areas, such as accounts payable, that experience will be helpful.
For ProSheet, you will need a slightly-better-than-basic understanding of Excel. This topic reviews some Excel capabilities such as absolute and relative referencing, but does not attempt to teach Excel.
Ideally, you should have completed a course in Financial Report Writing during General Ledger implementation at your hospital.
Users of the Financial Report Writer must have the role object General Ledger Report Writer set to Create as a minimum. The setting must be All if a user is both creating and deleting reports. The users' data profiles must include the appropriate organizations and departments.
The Chart of Accounts for a hospital is set up when General Ledger is implemented.
You can add accounts, change existing accounts, and delete accounts using the GL Account Import feature.

Account codes have a segmented structure. For each medical center, the account codes' segments are defined in the System Values. A pattern for an account code or group of account codes is a mask. A more detailed discussion of account masks is in the short topic "Using an Account Code Mask."
Figure 7 is an example of an overall account mask (marked in red) for a medical center. This medical center's account codes have four segments. The first segment contains three numbers (or letters), and each of the other segments contains four. This medical associates the first segment with an organization (which could be a hospital, or other facility) and the second segment with a department.
Note: Figure 7 displays a record that is created during implementation. The figure is here only for general information -- you cannot edit or change this System Value record.

You can use wildcards in a mask to have the application select multiple organizations for a report. For example, 00?-1234-5678 would select organizations 001, 002, 003, and any others in that pattern. When a medical center's organizations use different calendars, and you use a mask to specify the organization account segment, the period beginning/ending date values are always for the first organization that the application retrieves.
Detail accounts are normal accounts set up to track expenses, assets, liabilities, and so on. For example, a department's salary expense account is a detail account.
Summary group accounts ("summary accounts") summarize the data from a collection of detail accounts. The collection is identified in a summary account code mask. The mask may contain numeric or alphabetical values, wildcard characters, and operators (such as ":" to indicate a range). For example...
Suppose each department in a hospital's organization 001 has a materials expense account code in the form: 001 [dept. no] 2010 2710.
The account code is the same for every department, except for the department number.
- Department 6300 would have the account code 001 6300 2010 2710
- Department 6700 would have the code 001 6700 2010 2710,
and so on with other departments.
The mask for the summary group of materials expense accounts for all departments departments is: 001 ???? 2010 2070.
The ???? are wildcard characters that the system interprets as "any value." This mask creates a summary group account that collects the materials expense accounts' data for all departments. (You can create and use account masks with wildcards and other operators when you define financial reports. See Using an Account Code Mask.)
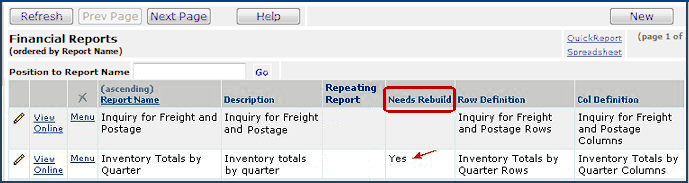
When a new account is added to the Chart of Accounts, the system evaluates all summary groups to determine which need rebuilding. If the new account matches a summary group's mask it will be included. The summary account rebuild process runs each night as part of the regular scheduled maintenance job. Alternately, General Ledger users can run the summary account rebuild process themselves, if needed.
From the General Ledger table of contents, select Financial Reports > Submit Rebuild for New Accounts.
Note: The Financial Report Writer and ProSheet will not run during the summary account rebuild processing.
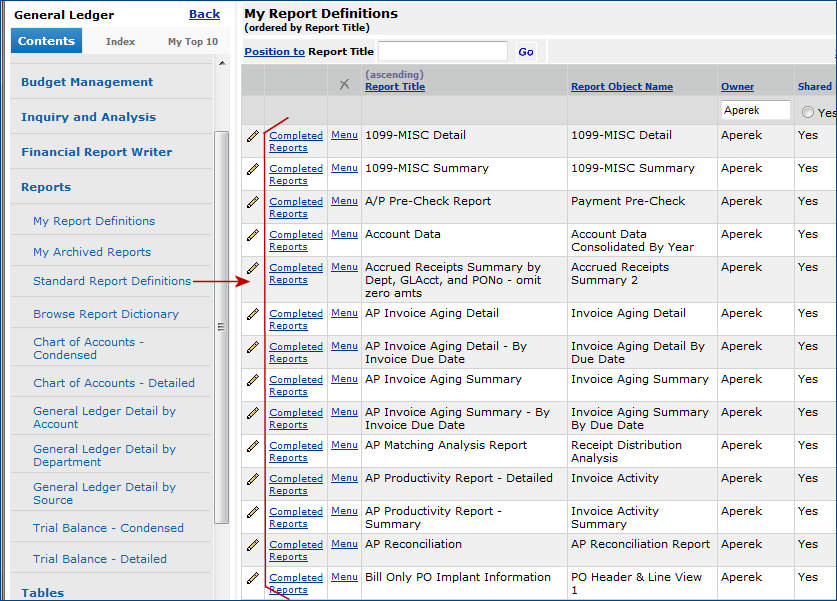
From the list of Financial Report Definitions (Figure 5), you can edit and run any report. The next few paragraphs take a look at report output to give you a context for how report definitions are set up. A detailed discussion on interpreting output and using drill down is in the section Running and Interpreting Output.
Suggestion: If you are new to writing financial report definitions, you may wish to create your first report by copying and then editing an existing report (if any are available). The instructions for adding rows to a new report are the same as the instructions for editing an existing row; similarly, for columns. Copying and editing a report may help you "get your feet wet" without starting completely from scratch. The short version of the copy process is below. For detailed information, see Copying a Financial Report Definition Created with the Report Writer.
The hospital that owns the report definition "Training Expenses by Type, Department " (Figure 8) has several departments with significant training expenses. Each department has three training expense accounts. The account code mask for this hospital has the structure:
AAA BBB CC DDDD
where AAA is the organization number, BBB is a sub account code, CC is the training type account, and DDDD is the department number;
e.g., 001-017-11-6100 contains conference travel (11) expenses for department 6100 in Organization 001.
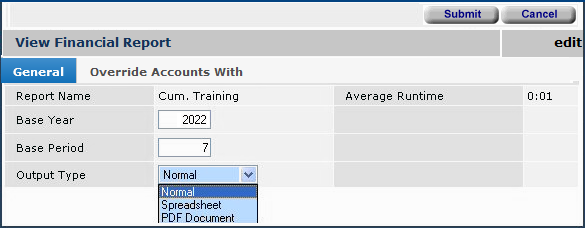
Figure 9 is output for "Training Expenses by Type, Department " for year 2022, period 7 for Organization 001. Figure 9 shows normal output; that is, the report is formatted for viewing on a computer monitor. You can output reports as .pdf files, text files, or spreadsheets as well.
This report displays travel expenses by the type of expense for each department, with a total for all departments. On the bottom of the report, totals by department for all types of travel expenses appear.
|
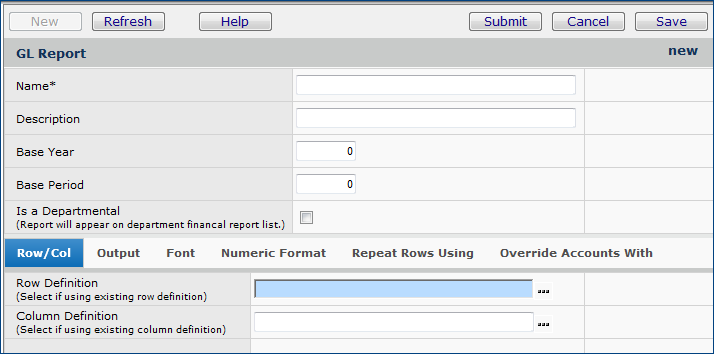
Advanced Notes on GL Report Definition Tabbed PanelsRow/Col tab - Lets you select stored row and column definitions (if any exist) for the report.Enter the definition names on the Row/Col tab. (See Financial Reports - Advanced Topics.) Note: Once row and column definitions are created for a report, they are available as stored definitions. You can then use the definitions again on other reports without having to re-create the definitions. Output tab - Contains fields that let you suppress zero rows and specify output characteristics. Also, you can repeat the header information after every few lines: The table contains a field for specifying the number of lines between repeats. Font tab
-
Specifies text characteristics; e.g., the Numeric Format tab - Formats numbers in output; e.g., currency symbol, how many decimal places, etc. Repeat Rows Using tab - Specifies additional accounts to be included in a report. Enter the Override Accounts With tab - Lets you run multiple versions of the same report for different organizations, departments, etc. |
The Financial Report Definition Editor lets you create and edit report rows and columns, write the report title, enter column labels, and specify other elements of a report. With the Editor, you can see a report definition evolve as you work with it.
Figures 11 and Figure 11A each display the Editor panel completed for the financial report: "Training Expenses by Type, Department." Figure 11 shows the report without annotations. Figure 11A is annotated. The paragraphs below discuss how to create each part of a financial report definition using the Editor.

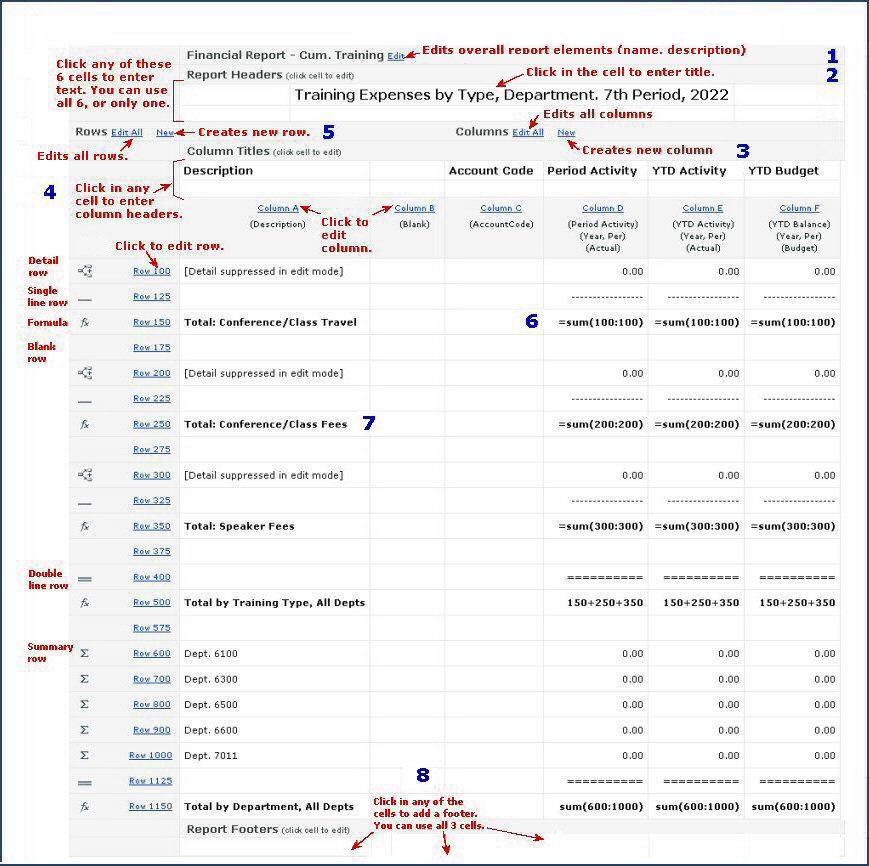
Each set of instructions below is numbered to match the same numbered location on Figure 11A.
Once you are working on a report definition, you may wish to make changes or specify additional characteristics of the report, such as the output format, the type face, and so on.
Enter a title for your report by clicking in one of the cells under Report Headers (see Figure 11A, 2) Six cells are available for title information, so that you can create a title in the center top of the report, a sub-title in the center as well, and right and left headers, if you wish. You can also use run-time substitution text to pull in values such as the current period and year, the date, an organization or department number, and others.
Run-time substitution text inserts information -- such as the current date -- in a report title, footer, or row/column header.
For example, in Figure 11 and Figure 11A, the text for the report title is:
Training Expenses by Type, Department, @Period Period, @Year
The substitution codes @Period and @Year generate the current period number (7 with "th") and the year (2022) when the report runs:
Training Expenses by Type, Department. 7th Period, 2022
Using the report Editor, you identify new columns for a report by entering column definitions.
(You can also specify
a stored column definition on the initial GL Report Definition panel.)
The instructions below are for the Report Editor.
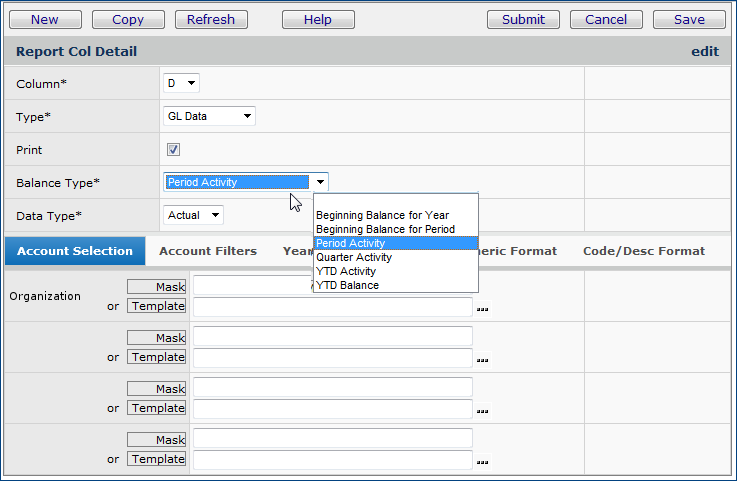
Column Identifies the column in the report definition. Select a column letter. The system validates letters used in column definitions to make sure that the letters are unique. Type Identifies the type of information in the column. Select a type:
When selected, Print prints the column on the report. Your reports may contain columns that you do not wish to output on the report; for example, a column that contains intermediate calculations used by a formula. Balance Type If the Type is GL Data, Balance Type indicates the time period for the balance shown
|
Advanced Notes on ColumnsMaximum Number of Columns Financial reports can contain 26 columns of data (A through Z). To print 26-column Financial Reports, use legal size paper. See Running and Interpreting Report Output. When sharing and reusing column definitions across multiple financial reports, you do not need to re-create the column titles. Column titles are associated with the column definition, not with the report. All reports that use the same column definition will have the same column titles. If you need different column titles in a report, copy the column definitions, change the column titles, and use the changed copy in the new report. Tabbed Panels You can select tabs at the bottom of the Report Col Detail panel to specify other parameters for the report. Below is a summary. (Click the Help button for details.) Account Filters - Applies selection filters to accounts for the report according to: Year/Period - Lets you specify how the year for the report is obtained when the report is run. For example, you can set a Base Year plus an offset value to report on data for years at the base year plus the number of years in the offset; e.g., 2021 + 1 ( = 2022 for the reporting year.). Font - Contains setting for typeface, size, etc. Numeric Format - Contains settings for the number of decimal places in data, the currency symbol, etc. Code/Desc Format - Lets you specify how much of the account code (in terms of characters) that you want to display on the report. |
Data Type
When the Type field is GL Data, Data Type indicates whether the amounts in the column are derived from a Budget or from Actual data.
Budget Type
If the Data Type is Budget, the Budget Type field opens for you to identify the type of budget. Select the budget type used at your site for
data in the column. (This value is used in Column F of the "Training Expense Report" - Figure 11 and Figure 11A) Options are:Budget 1 (Operating), Budget 2 (Flexed), Budget 3, Budget 4, Budget 5.An account for a department can be included only once for budgets of the same type for the same year.
Formula
If the Type field is Formula, cells in the column contain a formula. The Formula field opens for you to insert a formula. See the discussion of formulas for row definitions.
Column definitions take precedence over row definitions. So, for example, if you create a column definition that specifies three decimal places (0.000) for its data, you cannot create an intersecting row that has only one decimal place (0.0). The column setting would prevail for the intersecting row. You can, however, override a column definition with a row definition.
Entering a label for a column is similar to entering a report title. As you create columns, the financial report Editor builds a place for you to enter one or two headers. In Figure 11A, the title headers are: Description, Account Code, Period Activity, YTD Activity, and YTD Budget.
Rows typically contain either detail or summary account data, formulas, text, and formatting elements such as underlines and page breaks. In the report editor, you identify new rows for a report by entering row definitions. (You can also specify an established row definition on the initial GL Report panel.)
Ordinal POs
Enter the row number for the row in the Ordinal POs field.
Hint: You may wish to number rows in increments of ten or 100 (or some other value). This approach lets you insert rows later by specifying a row number smaller than each increment. For example, if rows are numbered 100, 200, 300, you can later insert a row 110, 150, or 275, etc.Row Type
Select the row type from the drop box. Rows can contain data, formulas, text, or formatting (line, space, page break).
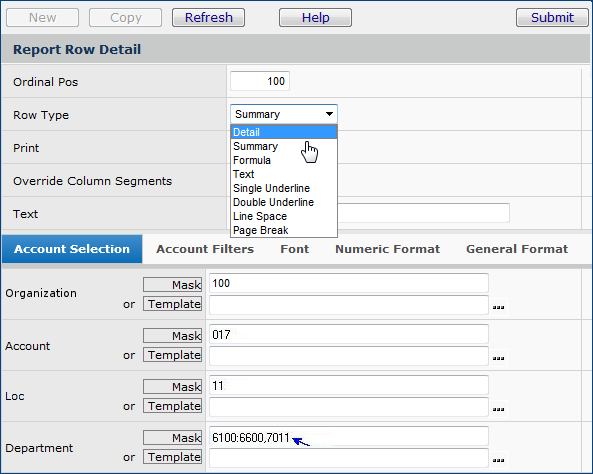
Concept: A row built in the Editor doesn't necessarily correspond to a single output row. For rows, what you are really defining is "report elements in the horizontal direction." You could create a single row definition containing an account code mask that pulls in many, many accounts. This situation is common, and occurs in the Training Expense report.
In Figure 13 (blue arrow), for example, notice that the Mask for the Department segment contains a range of values that indicate multiple departments' accounts. Physical rows for the accounts appear on the report output (Figure 9), even though only a single "row" is defined in the Editor.
Keep this concept in mind since it can also come into play for formula row entries.
Detail - A detail row shows information for one or more individual accounts. You can specify the account(s) using a template or a mask.
Summary - A summary row shows information for one or more summary accounts. You can specify the account(s) using a template or a mask.
Formula - The values in the cell are the result of applying a formula to account data. The rows containing the account data are specified in the formula. Enter a formula in this field. See Using Formulas.
- For a row that will contain text or format information, select one of these options:
Text - The row contains text. (See the discussion about Text rows.)
Single Underline - The row contains only a single underline. (See rows 125, 225, and 325 in Figure 11A.)
Double Underline - The row contains only a double underline.(See rows 400 and 1125 in Figure 11A.)
Line Space - The row is blank, and used as a spacer. (See rows 175, 275, 375, and 575 in Figure 11A.)
Page Break - The row triggers a page break.When the Print field is selected, the row prints on the report. A report may contain rows that you do not wish to output on the report. In that case, do not select Print for those rows.
In the report writer, you can override column account segments (if any -- columns do not usually specify GL account segments) with row segments. Check the box if the account segment(s) for the row override the segment(s) specified for columns.
Account Selection Tab
The Account Selection tab is used to identify the account
codes for reports' rows.In specifying account codes, you can select a stored row definition, select an
account code template, or write a new mask to identify accounts.
The mask is a shorthand that tells the system which account codes to include in
the report.
In Figure 13, for example, the mask contains:
Organization
001
Account
017
Loc
11:13
This shorthand with a colon : between two values indicates a range. In this case, the mask element means: all Loc segments from "11" through "13."
Department
6100:6600,7011
This mask element contains another range (6100:6600) and an additional department (7011) that is outside of the range.
Advanced Notes on Rows
A hospital sets up templates to identify account codes when the same group of accounts is used often for various general ledger activities. Account templates contain masks.
You can create and store templates by selecting
Account Management > Account Selection Templates from the GL main Contents.Tabbed Panels
Besides the Account Selection tab, other tabs on the Report Row Detail edit panel let you specify other row parameters. Below is a summary. (Help provides details.)
Account Filters - Accounts for the rows are filtered according to one or more Account Classes, which you can select: Balance Sheet, Profit and Loss and Statistical. You can also filter accounts by selecting the GL Account Type: Asset, Expense, Liability, etc.
Font - Contains settings for typeface, size, etc.
Numeric Format - Contains settings for the number of decimal places in data, the currency symbol, etc.
General Format - Contains a field to specify indent amount (in points) for rows. (An inch has 22 points.)
If Row Type is Formula, the system uses the formula that you specify to calculate a value. Formulas can contain the standard operators (+, -, /, x) and the sum function.
The sum function is:
sum(row:row) for a range of rows.
or
sum(row, row, row, ...) with rows separated by commas, e.g., 100, 121, 131, 150.
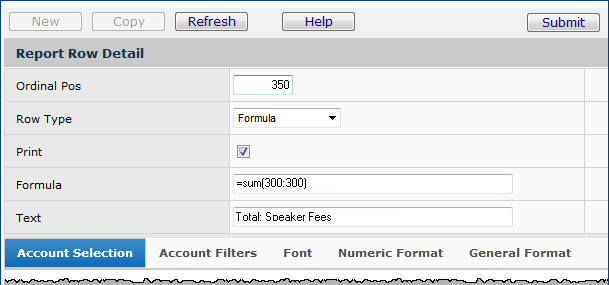
For example, row 150 in the report (Figure 11A) was built using the definition in Figure 14:

Formula Examples:
- In Figure 14, notice how the sum formula is written for row 150. (Similarly, in Figure 11A, look at rows 250, and 350.) The account mask for each of these rows specifies a range of departmental accounts. However, the formula uses the syntax sum(100:100); sum(200:200); etc. If you entered just the row number; e.g., sum(100), ProSheet would generate an error.
- In Figure 11A, row 500, the formula is simple addition of the three intermediate values calculated in rows 150, 250, and 350.
- Row 1150 (Figure 11A) sums the accounts in rows 600 through 1000.
A report can contain text in a cell whose Row Type is either Text or Formula, and whose Column Type is Description.
The cell where the row intersects the Description column contains the text. See Figure 11A, Rows 150, 250, 350, 500, and 1150 at Column A.
You can enter report footers if you wish.
If you are editing an existing report definition, when you finish, you must rebuild the report.
The system can generate output for financial reports formatted for immediate online viewing, "running while-you-wait." For short or uncomplicated reports, this approach can provide quick information. (Notice, on the Financial Reports list, Figure 5 and Figure 16, the Average Run Time column contains the average time that it takes each report to run.)
The system can also generate financial reports "running in the background," and store them in Completed Reports and My Archived Reports for later viewing and printing.
You can run a report from the Financial Reports List or from inside the Financial Report Editor.
Important: Repeating reports cannot be run using View Online (as described in the next steps) unless you override the repeating account segment(s). Otherwise, you must run a repeating report using the Print method)

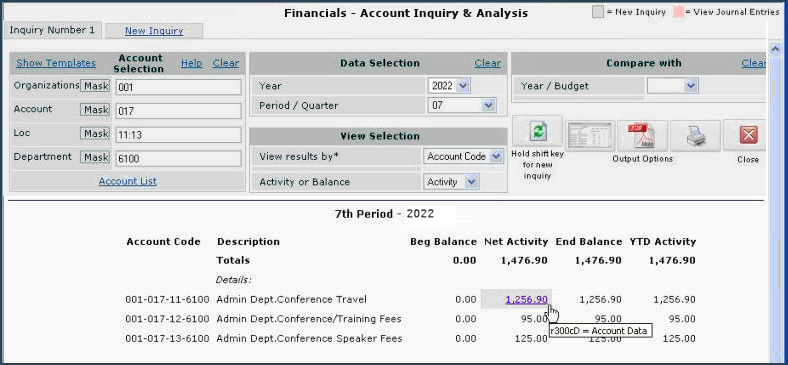
When you view a report online, the system enables drill down for account figures. Using drill down, you can get more information about a value in a report.
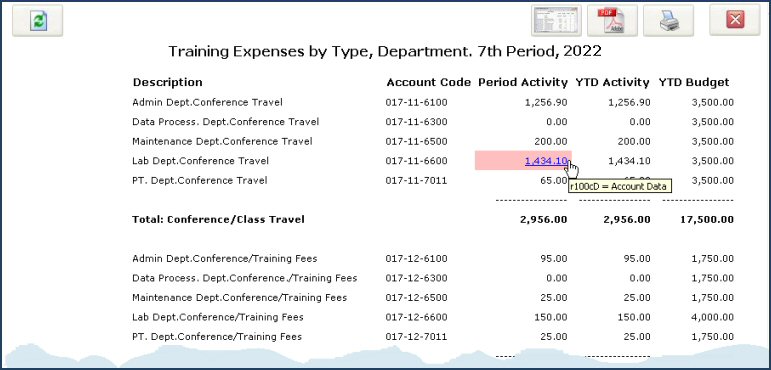
The Training Expense report contains the sum of several accounts. You can drill down on these values and view data for the accounts that are summed.
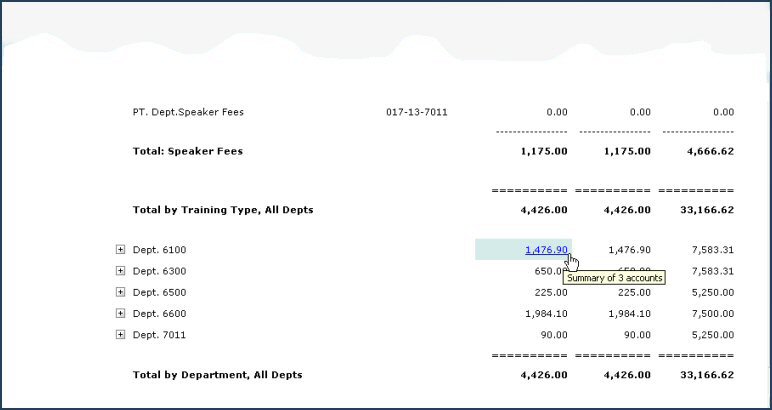
Also, next to the description of a summary value, you can open to the accounts that are summarized.
Opening a summary value provides the same information as drill down, except that if the summary value crosses several account segments; e.g., Department, Location, etc., you can open data for totals by each segment.

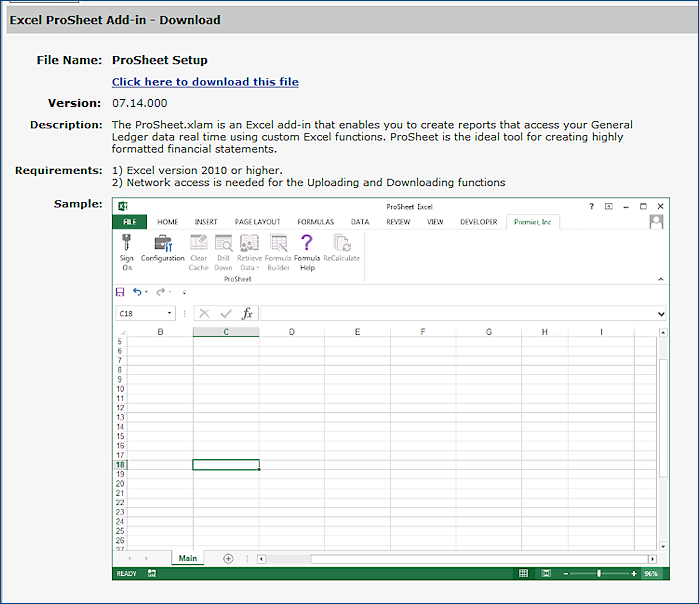
ProSheet is an Excel add-in that provides real-time, interactive access to General Ledger account information. Using ProSheet, you can create highly formatted, spreadsheet financial reports. ProSheet lets you upload/download data to the system. To use the ProSheet add-in, you first must download it from General Ledger to a network location where you can access it from Excel. Then, you install it on Excel (using an install wizard) and enable macros.
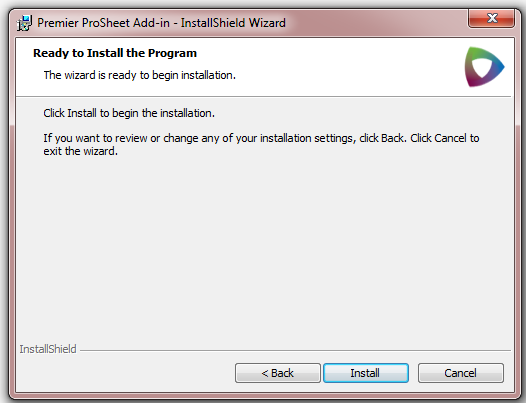
The latest version of ProSheet uses Excel 2010. If you need to install it, follow the instructions below. If you are currently using a previous version of ProSheet, you will need to disable it (by unselecting it) before proceeding with the install. The instructions below explain how to install, enable, and disable ProSheet.
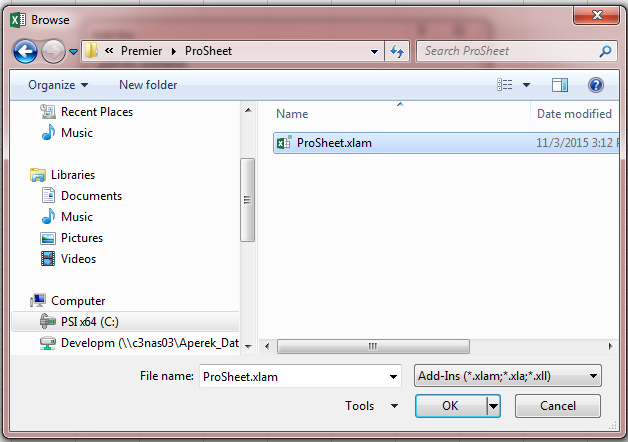
Caution: By default, the add-in file is named ProSheet.xlam. The download process overwrites any existing file with the same name. If you have an existing file with the same name, you may wish to rename it so that its data are preserved.
These instructions download and install ProSheet for Excel 2010. This version supports the sign-in process.
Important: members accessing the ERP General Ledger application through must use the new 6.0.3 version of ProSheet.
Users working with a version of Excel earlier than 2010 can continue to work with the older version of ProSheet, as long as they do not need to sign on through .
The Windows File Download panel appears. Depending on your Internet Explorer Security Settings, a verification panel may appear.


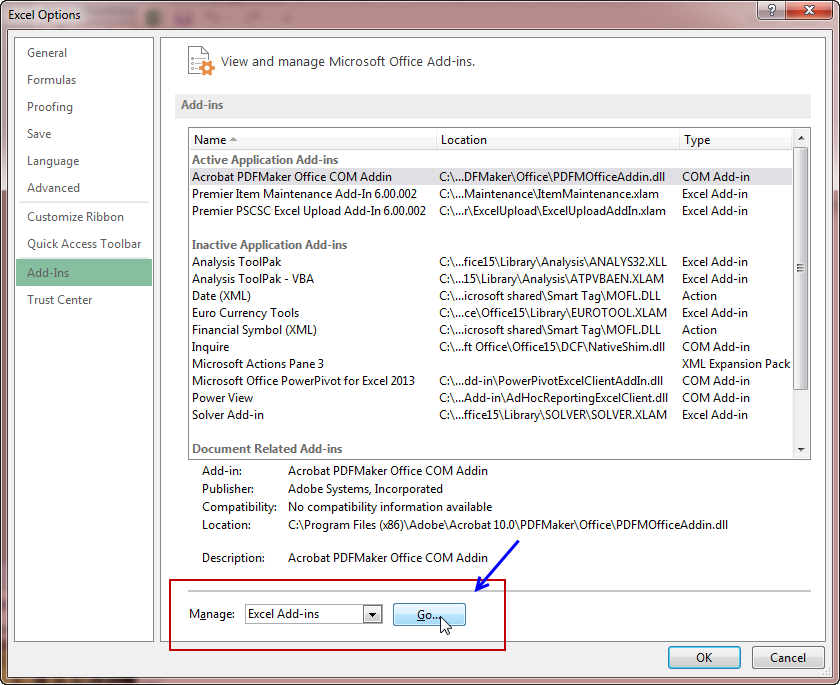
The steps for enabling an Excel add-in (once you have installed it) are the same as the steps to disable an existing Excel add-in (before you install a new version). The difference is that to enable the add-in, you select the box next to the add-in in the steps below (Figure 32). To disable the add-in, you unselect the box.
Note: You only need to perform the enable step one time.

ProSheet provides several tools for selecting account data and creating reports in Excel. The first step is to sign on.
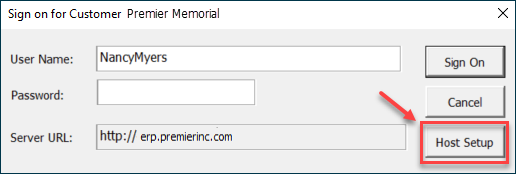
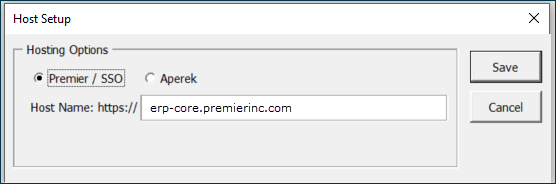
The first time you sign on to the Excel Add-In, you will need to select a host.
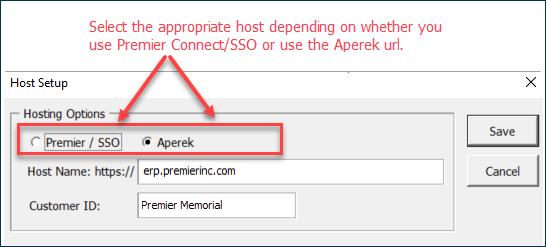
- Premier/SSO is for users who access ERP/SCM via Premier Connect as single sign-on (SSO) users.
- Aperek is for users who access ERP/SCM directly via the ERP application URL for their site.
- The default is the last option selected.When you select Premier/SSO, the panel changes to resemble Figure 37.
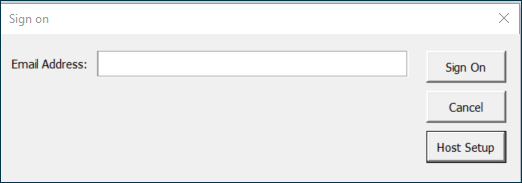
Your site's network/application login panel appears. Your site administrator can set you up with the correct URL and other parameters.
For SSO, the sign on proceeds as follows:
- The Excel Add-In directs control to the Premier Connect page.
- The Premier Connect page looks at the email address and decides if you are an SSO user or not.
- In case of incorrect credentials, the user will get invalid login message.
- Otherwise, the Sign On panel disappears and you are signed on.
Using ProSheet to create reports has some similarities to using the Financial Report Writer. You will need to plan the layout for your spreadsheet, including a title, headings for columns, and labels for calculated values. All of Excel's functions are available; plus additional account-related functions supplied with ProSheet.
You use Excel's features to perform activities such as:
ProSheet's capabilities let you...
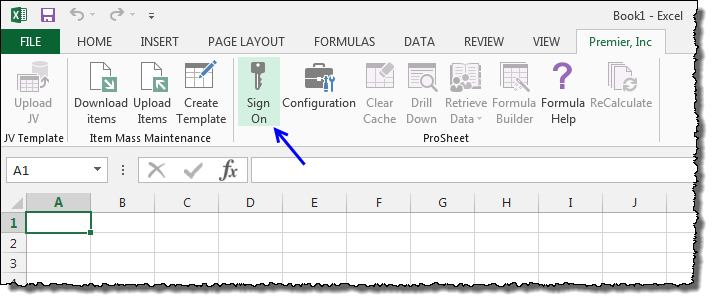
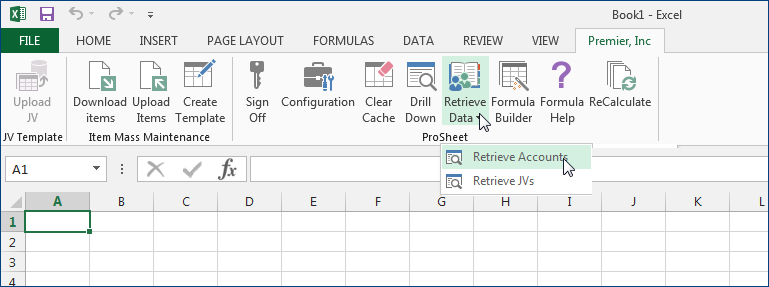
Once you sign in, the , Inc tab contains icons for the tools that you will use to retrieve data and build Excel worksheets. See Figure 39.
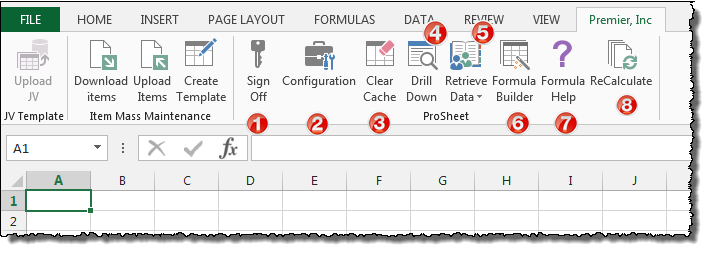
![]() Signs you off ProSheet. The other tool icons are grayed out when you sign off.
Signs you off ProSheet. The other tool icons are grayed out when you sign off.
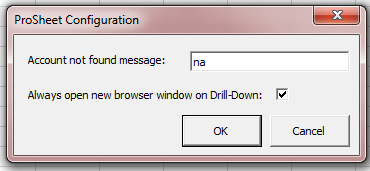
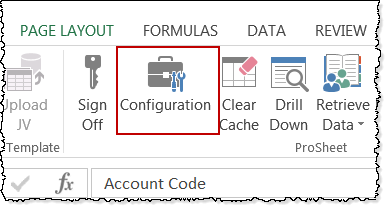
![]() Configuration sets up drill down and message options for your ProSheet session. The options available are on Figure 40.
Configuration sets up drill down and message options for your ProSheet session. The options available are on Figure 40.
- You can specify a message to be displayed when ProSheet cannot find a requested account.
- You can require the system to open a new browser window when the report user drills down on a summary account.
![]() Clears Cached data in ProSheet. This feature is explained in a subsequent section.
Clears Cached data in ProSheet. This feature is explained in a subsequent section.
![]() Drills down from a summary account to separate accounts.
Drills down from a summary account to separate accounts.
![]() Retrieves account data from your site's General Ledger database.
Retrieves account data from your site's General Ledger database.
![]() Assists you in building formulas. Click
Assists you in building formulas. Click ![]() Formula Help for instructions (also repeated below).
Formula Help for instructions (also repeated below).
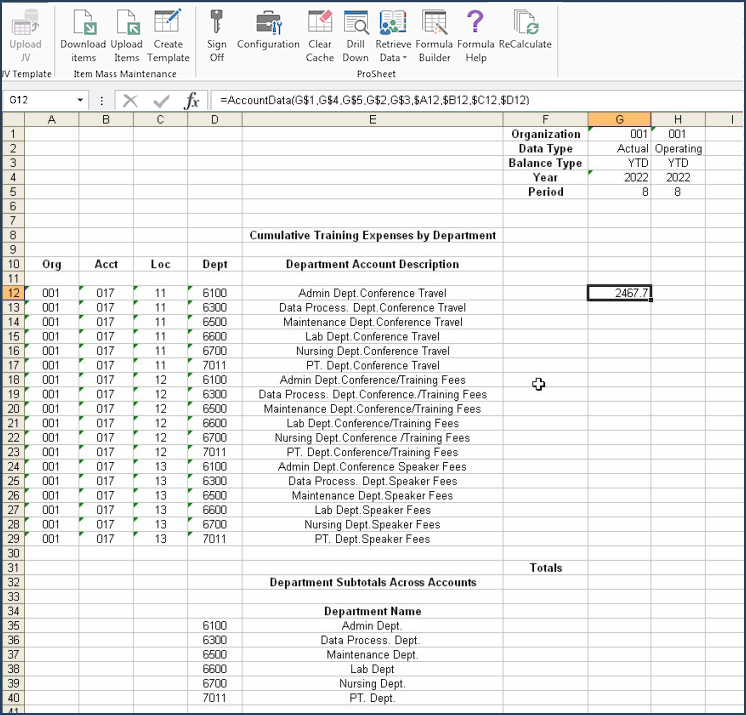
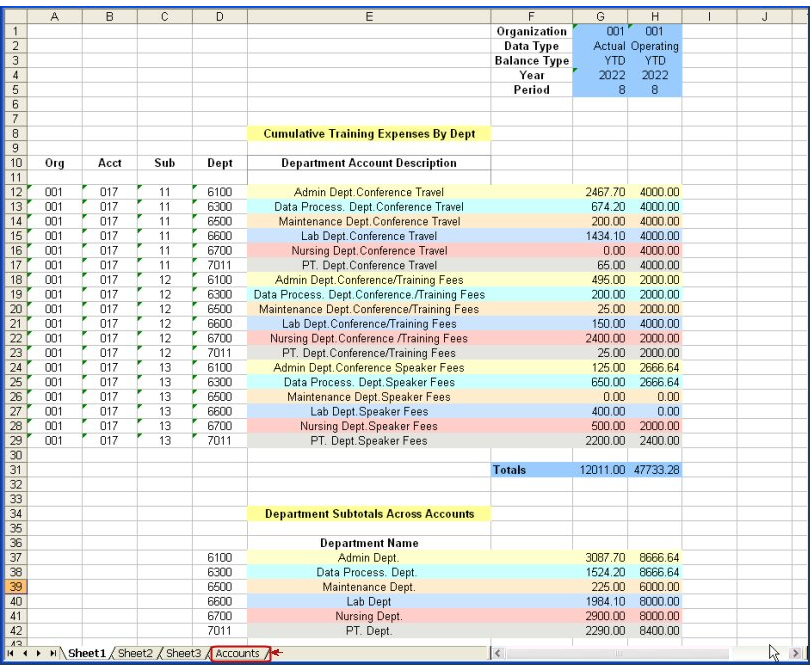
Figure 41 is a sample spreadsheet report built with ProSheet. The report compares year-to-date actual training expenses to the training budget for each of several hospital departments. Each department has three training accounts: Conference Travel (11), Training Fees (12), and Speaker Fees (13). Account data is displayed by individual account, and summed across all three accounts for each department.
The sections below dissect the report so that you can see how ProSheet is used.
Note: The Accounts worksheet (red circle, at the bottom of Figure 41) was created by ProSheet. Its use is described in the next section.
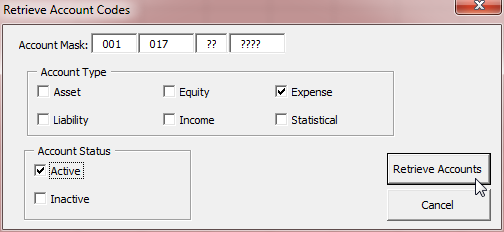
To select accounts for a report, you use a mask that identifies the accounts. You can filter the accounts selected with the mask for Account Type and whether the account is active or inactive.
Note: In this step, ProSheet just gets a list of accounts. The actual data for accounts depends on the period, year, and type of balance. The actual data is the essence of the report, and how to retrieve and use account data is the topic of further sections.
The Retrieve Accounts panel appears (Figure 43).
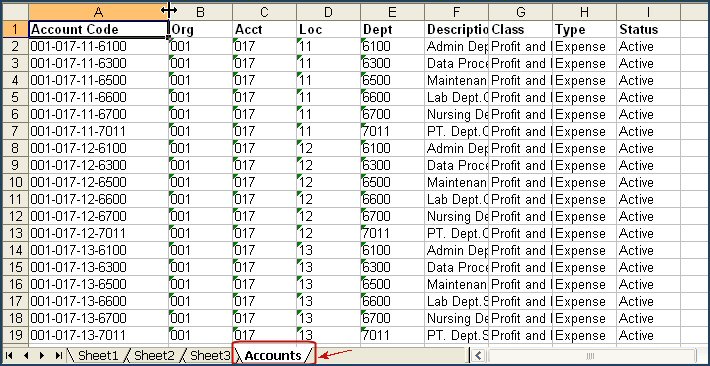
You may not wish to display all the information in each account line on your final report. From the Accounts worksheet, you can selectively copy account information to another worksheet. In the Sample Report (Figure 45), the Org, Acct, Loc, Dept, and Description columns are copied to Sheet 1. The columns have been sized, formatted, and labeled.
Sections below discuss the next steps in writing the report: retrieving account data and calculating values.

The "Training Accounts" example in this section contains formulas that use both absolute and relative cell referencing.
Excel spreadsheet cells are addressed (or "referenced") by their column and row numbers, column first. For example, in the spreadsheet below, the top left cell is A1 and contains "1951," and the bottom right cell is D5 and contains "1972."
| A | B | C | D | |
| 1 | 1951 | =A1 | ||
| 2 | 1952 | |||
| 3 | 1956 | |||
| 4 | ||||
| 5 | 1961 | 1968 | 1972 |
Suppose you created a formula that set the value in C1 to equal the A1 value. You enter " = A1" in cell C1. "A1" in the formula (=A1) is a relative cell reference.
When a formula containing a relative cell reference is copied to a different row and/or column, the cell reference changes to accommodate the new column, row, or both.
If you copy the formula " =A1" from cell C1 to cell D1, you will notice that the cell column reference changes. The table below shows how the column reference adjusts so that the formula now contains "B1," not "A1".
| A | B | C | D | |
| 1 | 1963 | =A1 | =B1 | |
| 2 | 1964 | |||
| 3 | 1956 | |||
| 4 | ||||
| 5 | 1961 | 1968 | 1963 |
To prevent this change from happening, you need to use an absolute cell reference: precede the column letter with $. You would enter " =$A1" in the cell C1. Then, when you copy "=$A1" to cell D1, the column reference (A) will not change.
An absolute reference has either a column element or a row element (or both) which does not change when the formula containing the reference is copied. A $ precedes the element(s) that cannot change.
In the Training Report, you will see how an absolute reference is used for a row. For example, in the spreadsheet above, the format of an absolute row reference would be: =A$1.
Finally, you will probably run into situations where you need an absolute cell reference for both the row and the column: e.g., =$C$5. In this case, when the formula is copied to a new row and/or column, neither the row or column reference changes.
The section below on defining ProSheet rows and columns revisits cell referencing so that you can see how it works in a spreadsheet.
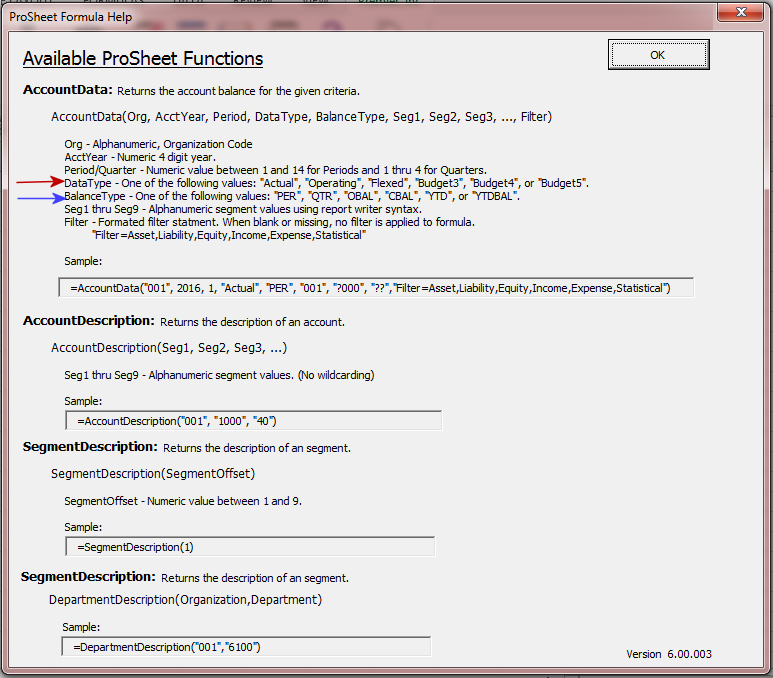
For ProSheet reports, you will need to write formulas that retrieve and run calculations on account data. Formula Help provides the structure of three key ProSheet functions:
AccountData – returns the account balance for the given criteria. You specify the criteria using the function's variables.
AccountDescription – returns the description of an account.
SegmentDescription(SegmentOffset) – returns a segment description. Two functions are currently available:
Click Formula Help on the toolbar to display the account functions (Figure 46). The ProSheet report being built will use the AccountData function with the Actual and Operating Data Types, (Figure 46, red arrow) and a YTD Balance Type (Figure 46, blue arrow).
The Training Report (Figure 41) contains data for several detail training accounts. The report compares each account's year-to-date Actual balance to the year-to-date Operating Budget balance for a particular year and period. The report also totals the accounts for each department, and then performs the same comparison on the totals.
Refer to Figure 41:
Rows 1 through 5 at the top of the report contain the values used in the report for Organization, Period, Year, Data Type, and Balance Type in columns G and H.
Each detail account code is listed on a separate row, by segment, in columns A through D.
The account description is in column E.
The Actual detail account figures are in column G. A total is also calculated.
The Budget detail account figures are in column H. A total is also calculated.
The bottom of the Training Report contains a row for each department's total across all three of its training accounts.
Each department total is listed on a separate row by department -- the description (in column E) has been shortened to just the Department Name.
The Actual department totals are in column G.
The Budget department totals are in column H.
The list below outlines the basic strategy to use in creating the report. Subsequent sections explain the details.
For the detail account portion of the report...
For the department totals portion of the report...
You can enter the AccountData function in a spreadsheet cell either by keying it into the formula box or by using the ProSheet Formula Builder (which is much easier).
The example below writes a formula in cell G12. The formula contains the AccountData function and is written so that it can be copied to other cells.
The Formula Builder contains fields for entering the account data criteria and the account mask. You can enter either options, such as "YTD" for Balance Type, or you can enter cell references from the spreadsheet. The Formula Builder panel in Figure 47 contains only cell references. The cell references are explained below.
You can further specify your accounts with filters. The filters are in the box at the top of the Formula Builder (Figure 47, yellow box).
You can also use a stored account selection template instead of a writing a mask to specify accounts. (The topic Using Account Templates explains how to create and save account selection templates.) The list of stored account selection templates that you can work with are in the Selection Templates list on the right side of the Formula Builder (Figure 47, red arrow). All your stored account selection templates are available for you to pull into ProSheet, except those that may be restricted to particular organizations. A discussion of how to set up account selection templates and how to restrict templates to particular organizations is in the advanced topic: "Restrict an account selection template by organization."
Note: If an account selection template is restricted to particular organizations, you can only access the template and use it in ProSheet if the organization is included in your Data Profile. The account selection template will not appear in the Formula Builder Selection Templates box.
Using Cell References in the AccountData FunctionThe following paragraphs explain the green and blue annotations in Figure 47. In the discussion below, cell names (e.g., H12) are in blue. Cell contents, which include cell references, are in black (e.g., "YTD", G$12). 1. The value in spreadsheet cell G1 is 001. This value is the Organization number. The Organization is same for both the Actual data that will be in column G and the Operating Budget data in column H. On the Formula Builder field for Organization (Figure 47), you could enter the value "001" (with quotes) instead of the cell reference G$1. To make the report easier to change; however, the formula uses cell references. With cell reference G$1, the row (1) is absolute and the column (G) is relative. When you copy the AccountData function that contains G$1 from cell G12 to cell H12, the G column reference changes to H, but the row reference is still 1. So, the copied AccountData function in cell H12 will contain H$1. 2, 3. Cells G4 and G5 contain values for the Year and Period . On the Formula Builder for Year and Period, G$4 and G$5 are entered. These cell references have a relative column and an absolute row. When you copy the formula containing G$4 and G$5 from cell G12 to cell H12, the G$4 cell reference becomes H$4 and G$5 becomes H$5. Formulas in the spreadsheet that work with Actual Year or Period data only need to use these two cell references. This approach makes the report easy to run for different periods and years: the only change needed will be in two cells. 4. The value of Data Type in cell G2 is Actual. Data Type is a variable used by the AccountData function, and Actual is a valid option (See Figure 46, red arrow. Notice that Operating is also a valid option.) The Formula Builder panel contains the cell reference G$2 to point to the Actual Data Type in cell G2. The cell reference G$2 has a column portion that can change when the formula is copied, but a row portion that does not change. When the AccountData function that contains G$2 is copied from cell G12 to cell H12, the G column reference changes to H and becomes H$2. The change is correct because the Operating Data Type is the contents of cell H2, and the H column displays operating budget data. 5. Cell G3 on the spreadsheet contains the Balance Type YTD. The Balance Type field on the Formula Builder panel contains the cell reference G$3. This cell reference has a relative column (G) which can change, and an absolute row (3) which does not change. When you copy the Account Data function from spreadsheet cell G12 to cell H12, the G in the G$3 cell reference changes to H. The formula in cell H12 then contains H$3. Although cell H3 currently holds the value " YTD", conceivably, cell H3 could be changed to contain a different Balance Type value if the report is run at another time. So, instead of "YTD", the cell reference is used to make the report more flexible. 6, 7, 8, and 9. The AccountData function for cell G12 requires the account segments. The account segments are located in the spreadsheet columns A through D, with one account code per row in rows 12 through 29. Instead of entering a mask for the accounts on the Formula Builder fields, cell references are used. The formula is written once for cell G12, and then copied to the other cells in the G and H columns. For the cell references, the columns will not change because each account segment is always in its particular column. However, the row values do change. In this case, therefore, as compared to cell references for the criteria (above), the column is an absolute cell reference, and the row is relative. A $ occurs before the column letter. The values entered in the Formula Builder fields are:
|
To copy a formula from one cell to a group of other cells, use the Excel copy utility. Refer to Figure 48.
For the G column:
-
Select the cell G12 and drag its fill handle (in its lower right corner) down over the cells in the rest of the G column to row 29.
The column cells populate with dollar values.
For the H column:
- Select the cell G12 and drag its fill handle right to the H column.
Cell H12 populates with a value.
- Select the cell H12 and and drag its fill handle down over the cells in the rest of the H column to row 29.
The H column cells populate with dollar values.
If you like, select any of the cells in the G or H column and look at the formula in the Excel formula box. You can see how Excel changed the cell references for rows and columns. For example,
Cell G21 has this formula:
=AccountData(G$1,G$4,G$5,G$2,G$3,$A21,$B21,$C21,$D21)
Cell H16 has the formula
=AccountData(H$1,H$4,H$5,H$2,H$3,$A16,$B16,$C16,$D16)
If you have not done so, now is a good time to Format the G and H columns for dollar data, with two decimal spaces.
At the bottom of the G column, create a labeled cell (in this case, G31) for the sum of the column values. Similarly, cell H31 will contain a sum.
=sum(G$12:G$29)
Excel populates the cell with a total value.
Drag the formula from the G column to the H column. Excel populates the cell. The formula for the H column total contains:
=sum(H$12:H$29)
The bottom of the report contains a total for each of the five departments for all training expenses.
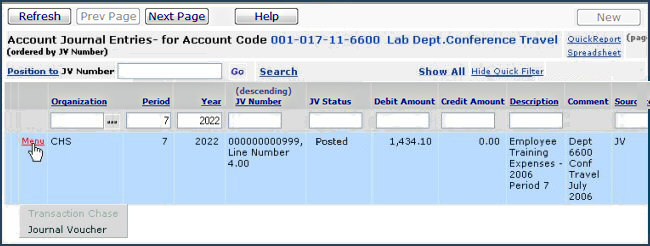
You can drill down to account details from a ProSheet report.
Information appears on the General Ledger Account Inquiry and Analysis panel for the account (Figure 50).
Using the Account Inquiry and Analysis panel, you can drill down further to look at journal entries and journal vouchers for account data. When you move the cursor over a detail value, the system highlights the numbers in pink (Figure 50).
Figure 51 displays tools that download account data to ProSheet. The user’s Data Profile applies to account data downloaded via Retrieve Data (accounts or JVs) and Formula Builder. See the previous section on data security.

Clicking Retrieve Accounts opens the Retrieve Account Codes panel. An example is in Figure 52. (Alternately, you could select Retrieve Data > Retrieve JVs. Data Profile settings would also apply.)
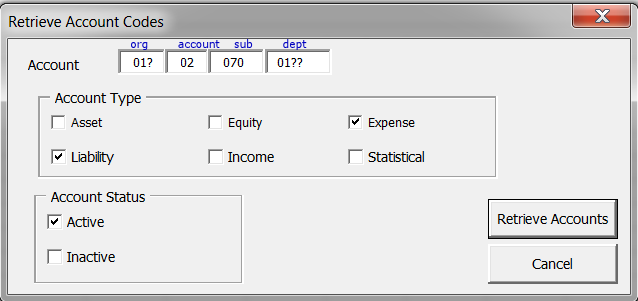
Since account codes have a segmented structure, to capture multiple accounts, without listing every account, you create a pattern – or mask – for the group of account codes to be retrieved. Typically, one account segment identifies the organization, and another identifies the department.
To capture data in multiple organizations’/departments’ accounts, you enter a beginning organization/department code in the mask and include a wildcard symbol (?). The wildcard symbol instructs ProSheet to pick up other organizations/departments that fit the pattern.
For example, suppose you have an account pattern as follows:
Segment 1 – organization numbered from 001 to 013.
Segment 2 – account identifier: between 01 and 99.
Segment 3 – account sub-identifier: three numbers
Segment 4 – department, numbered from 0100 to 0210.
Figure 52 contains a mask used to download liability and expense account data for...
Organizations 010 to 013
. . .with an account value of 02
. . .and a sub-account value of 070
. . .for departments in each organization numbered 0100 to 0210.
If you are using ProSheet Data Profile Security, you must have Data Profile access to all the departments and organizations specified or covered by a mask. If some of those organizations/departments are not included in the user’s Data Profile, their account data is not accessible, and is not downloaded to ProSheet.
Instead, a zero (0) appears on the spreadsheet line where the account data would otherwise be written.
Zero is the default. However, you can configure the value that appears, if you wish to use something more meaningful to your users; for example “Restricted data” or “Not authorized.” Instructions are below.
In Figure 52, for example, if the user had access to every “01...” department, except for Department 0123, then account data for Department 0123 (which was not in his/her Data Profile) would not be downloaded.
The example in Figure 52 is for the Retrieve Data tool in ProSheet. Your Data Profile also controls data for ProSheet functions that return account data values. The Formula Builder button (Figure 51, next to Retrieve Data) lets you create formulas/functions. Functions may contain organization and department segments, or masks that identify organizations and departments. (See Using ProSheet Functions to Retrieve Account Data).
In formula/function masks, organizations/departments can be specified literally, or retrieved using wildcards (e.g., “1?10”), ranges (e.g., “1267:1277”), and other selection shorthand. Templates for accounts defined in the Financial Report Writer can also be called in to ProSheet functions. See Figure 48 for an example of the Formula Builder with the available templates in the lower right.
If the organizations/accounts referenced by any of these methods are not your Data Profile, then account data for those organizations/departments does not download. Instead, the ProSheet lines will contain a zero, or whatever message you have configured.
When you drill down on summary accounts to display detailed accounts for different organizations and departments in ProSheet, once again, you can only display organization/department data that you are authorized to see.
Bypassing the Data Profile Security Feature
A field has been added to the System Values panel that allows sites to turn off ProSheet security (Figure 53).
- The field is: Bypass ProSheets/I&A/Fin Report Writer Security (Figure below)
- The default setting is “unselected” (ProSheet security is enabled). The system performs the data profile check.
- To bypass (disable) ProSheet, Financial Reporting, and Account Inquiry data profile security, check the field.
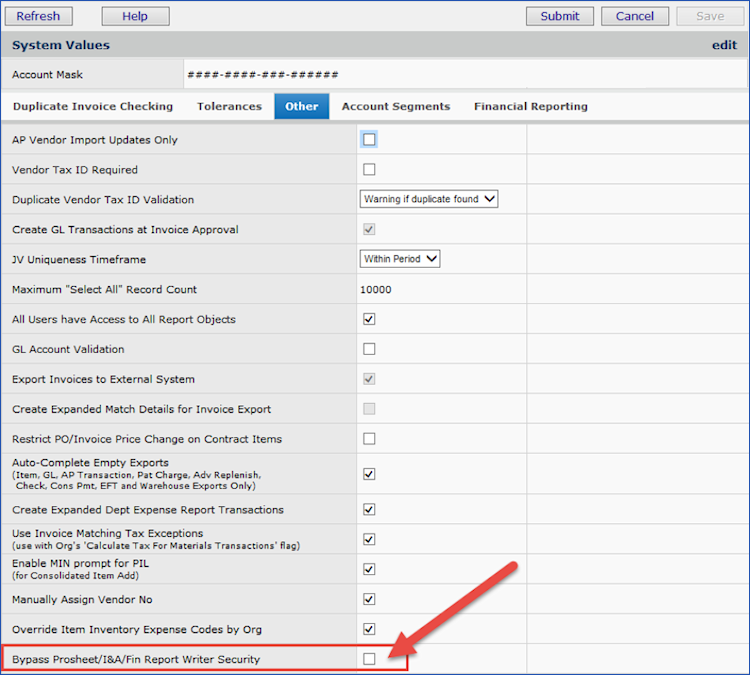
To access the System Values panel, from Work in Administration, select Administration > System Values > edit > Other.
Note: The latest version of ProSheet is 06.08.007. You do not need to download ProSheet to avail yourself of this security enhancement. But, if you wish to configure a message for unauthorized accounts (other than the default of 0), you do need to download and re-install the latest version.
Usage: To configure a message for account data that is not allowed:
The ProSheet Configuration panel appears (Figure 55).

While you are work with ProSheet, the account data that you are using is kept in ProSheet's local cache (pronounced like Johnny Cash). The cache is just a memory location, similar to the cache of visited files that your browser keeps while you are surfing the web.
If you want to see a page again, your browser, for example, loads the page from its cache, rather than reading the page from the original URL address. Reading from the cache is much faster. The situation is the same with ProSheet: while you are working with ProSheet, when you refresh or re-calculate the spreadsheet, account data is re-loaded from the ProSheet cache.
Of course, your account data in the system may not stay the same over a period of hours, or minutes. If you are working with ProSheet, you may want to periodically clear the cache of stored data. Once you clear the cache, when you refresh or re-calculate the spreadsheet, ProSheet brings in new, updated account data from General Ledger.
Copyright © 2023 by Premier Inc. All rights reserved.