The Services Analysis feature provides tools for segmenting services spend dollars for analysis. Vendors of services contracts are assigned services categories. You can select services categories to segment and examine spend. You can also look at spend for individual vendor entities, regions/organizations, and contracts. You can also work with all spend.
The analysis tools provide actual spend data from the past 12 months.
Important: Services contract type security is not used in the services analysis workbench. Users at all levels of security can display data for services contracts of any type.
If you are working with supply contract spend, see "Examining Supply Contract Spend."
Customers have the option of enabling/disabling the Shared Services Analysis feature as part of their SCM package. This feature is initally enabled by default.
When this feature is disabled, users cannot work with shared services spend data and analytics. The SCM main menu does not provide a Services Analysis element. Also, when this feature is disabled, any shared services gauges, such as these below are not available:
Contact the Help Desk or your Premier Consultant to enable or disable this feature.
The role object "SharedSvcsAnalysis" controls access to this feature. To display the "Shared Services Workbench," the minimum setting must be View. For details about the settings required for the activities within this menu, see Role objects associated with Sourcing and Contract Management .
The analysis tools create dynamic analysis groups that segment a hospital's total services spend according to descriptors that the analyst selects. For example, a services analysis group might contain spend data for...
... a particular service category, such as "Travel and Car Rental" or "Printer/Copier Maintenance"
...from selected vendors
...associated with particular regions/organizations.
Put together, "service category," "vendors" and "regions/organizations" identify a segment of spend data -- an analysis group.
An analysis group is fluid: you can "slice and dice" the spend by changing, removing, or adding spend descriptors. For example, you may wish to know which vendors account for the highest percent of spend Temporary Labor.
The Vendor Spend section of the Product Index Layer documentation discusses spend in detail. Here are key points about spend:
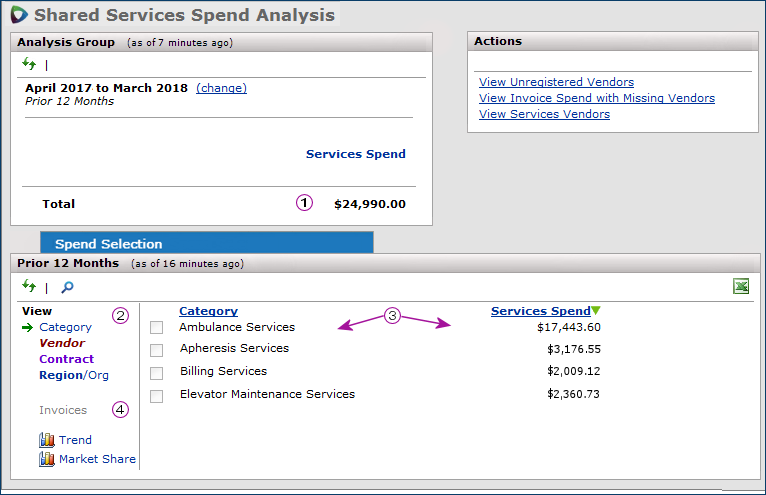
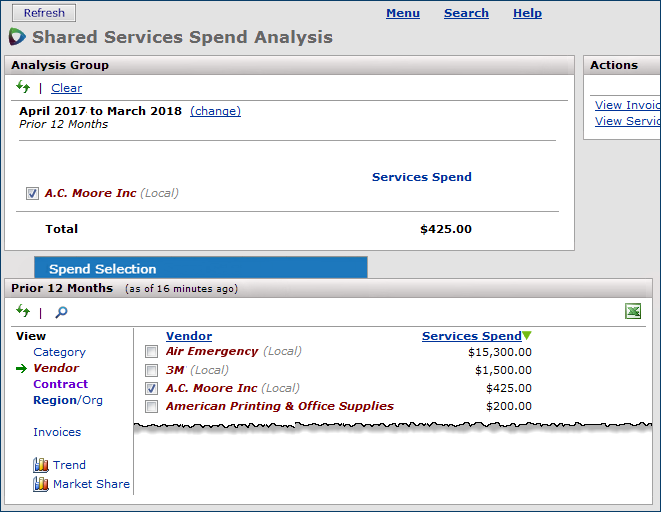
Figure 1 is the "Shared Services Spend Analysis" page. The Analysis Group panel displays the default view of spend.
![]() The Analysis Group panel initially displays the total spend dollars (Figure 1, top, left).
The Analysis Group panel initially displays the total spend dollars (Figure 1, top, left).
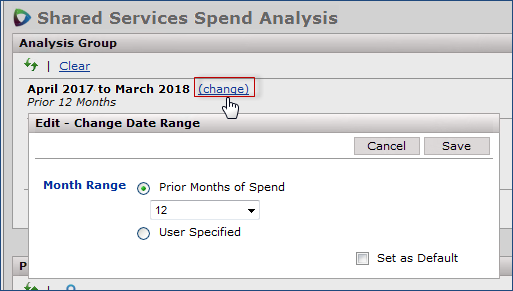
By default, spend is displayed for the previous 12 months, but you can change the time period. You can specify any date range for which you have services spend history.
Note: Spend data for services contracts that expired before the selected beginning date is not displayed.
When you create an analysis group by identifying spend segments, this panel displays spend for the analysis group.
![]() The Prior X Months panel (Figure 1, bottom) shows spend organized according to the Views on the left, and for the time period that you set on the Analysis Group panel (by clicking change).
The Prior X Months panel (Figure 1, bottom) shows spend organized according to the Views on the left, and for the time period that you set on the Analysis Group panel (by clicking change).
The Views -- Category, Vendor, Contract, and Region/Org -- let you specify how spend dollars are displayed.
-
The default view is Category.
Typically, categories are assigned to entities that have services vendors registered to them. (But, categories can also be assigned to vendor entities that have registered supply vendors.) See the Editing Vendor Entity Records for a discussion of assigning categories.
-
You could also display all services Vendor entities with spend for the time period.
-
Similarly, you could display all Contracts with spend, or all Regions/Orgs with spend.
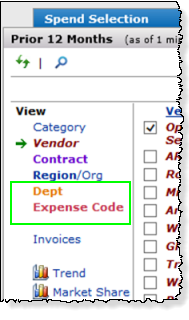
Two additional selectors are available: Dept and Expense Code (GL account). See Figure 1A. To use these selectors (which are not otherwise visible), the application must have your department spend and expense account data populated in its tables from your general ledger. If you wish to analyze spend using the Dept and Expense Code selectors, contact the Solutions Center (aka, HelpDesk) to discuss how to provide the data to SCM. (Stand-alone sites use connectors.)
![]() The center of the panel lists spend dollars grouped according to the selected View, and broken into the various view elements.
The center of the panel lists spend dollars grouped according to the selected View, and broken into the various view elements.
-
Category displays spend by each category that has spend. If a registered vendor has no category assigned, then its spend cannot be displayed, and you cannot analyze it. (For this reason, when you register a services vendor, be sure that you select a services category.)
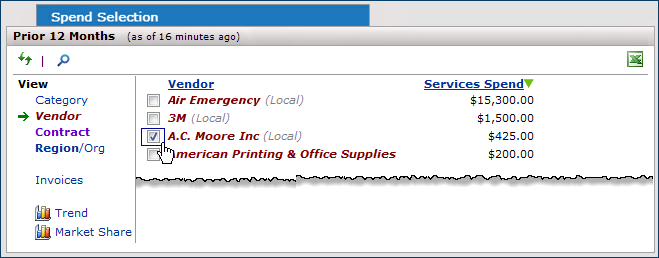
- Vendor displays spend for each vendor entity that has spend. (Local) appears next to any vendor entity that is local.
- Contract displays spend for each contract that belongs to a services vendor.
- Region/Org displays spend for each region/organization that you have defined in Sourcing and Contract Management.
Use the Views and the search tool ![]() on this panel to identify a segment of spend for further analysis.
on this panel to identify a segment of spend for further analysis.
On the main Contents, Shared Services tab, click Analysis Workbench.
The Analysis Workbench panels appear (Figure 1).
Accept the twelve months default time frame for the spend, or select a new time frame.
The columns of data on the Prior X Months panel are sortable. Click an underlined column header to sort in ascending or descending order.
A green arrow ![]()
![]() indicates the direction of sort.
indicates the direction of sort.
Table 1 is a summary of how to organize spend using the different View descriptors. Once you have selected a descriptor, you can click
the search icon ![]() to find a particular element. For example, clicking Vendor organizes spend by vendor entity.
to find a particular element. For example, clicking Vendor organizes spend by vendor entity.
Clicking ![]() opens a search box so that you can look for a particular vendor entity.
opens a search box so that you can look for a particular vendor entity.
Similarly, in the Category view, click ![]() to search for spend in a particular services category.
to search for spend in a particular services category.
| To display spend by... | Click this descriptor... |
Categories of services assigned to vendors |
Category This view is the default. You can display a complete list of categories available for assignment to services vendors. From the Administration menu, select Tables - Shared Services > Service Categories. |
Vendor entities |
Vendor |
Contracts
|
Contract - Contract numbers containing spend are displayed. |
Regions and organizations |
Region/Org - The list of regions/organizations with spend appears. |
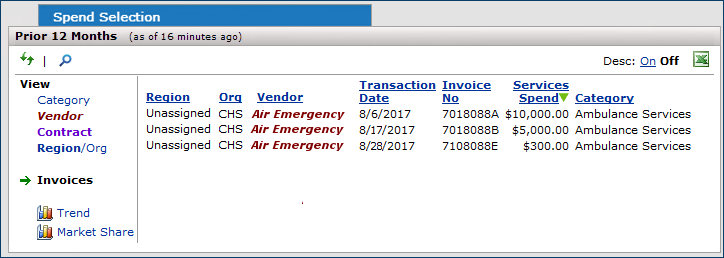
The Invoices (Figure 5) view displays spend on individual invoices for an analysis group.
For All spend, the Invoices link is grayed out.
Note: In addition to the columns on the panel (Figure 5) , the Invoices view also displays the Dept and Expense Code, if used by the site, and included in the data available to the system (i.e., for stand-alone sites, these values would need to be passed in via a connector). If not available in the spend data, the columns do not appear.
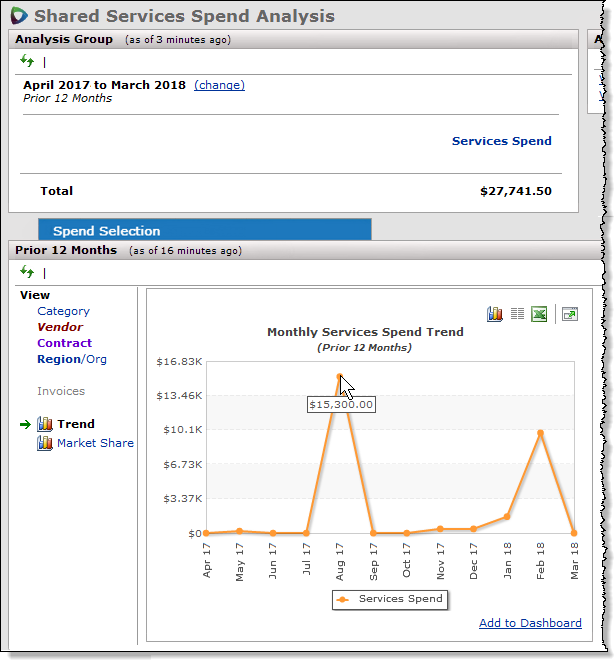
The Trend view displays a graph that lets you see how spend dollars are trending over a period of the prior 12 months.
You can display a trend for an analysis group, or for all spend.
Figure 6 is a trend graph for all spend.
Notice (on the bottom, lower right) that you can add the graph to any dashboard that you have created.
Imagine that you have created an analysis group, and that you wish to see how spend for each one in the group is trending (Figure 7).
Note: The group was created by selecting spend from two vendor entities, but it could have been created using one or more categories, contracts, or regions/organizations.

Figure 8 graphs vendor entity market share for an analysis group with spend from several vendors. The graph displays spend from the previous twelve months.

From the graph, the spend segment provided by American Printing was 100% in May. For A. C. Moore, it was 100% in December. The spend for both vendors was flat in other months. If you wished to expand this analysis group to see spend for other vendors in the same services Category (or different categories), or for any group of Vendors, you could do so. Similarly, you could look at vendor market share if you had used Contracts to create the analysis group, or if you had used Regions/Orgs. When more spend dollars exist for the months in the graph, you would see additional lines representing the vendors and percent spend.
% Spend per month for a sub-group (e.g., A. C. Moore) =
Spend per month for the sub-group (A. C. Moore / Total spend per month for all sub-groups.(e.g., Air Emergency + 3M + American Printing + A .C. Moore + all the other vendors.)
If you know that you have spend for a services vendor, but the spend is not displayed (on the Prior 12 Months panel), the vendor may be unregistered. Spend for unregistered vendors is not available for analysis.
The Actions panel (Figure 1, top, right) provides a shortcut for registering the vendors.
On the Actions panel link...
You can also work with registered and unregistered vendors from the Administration menu.
On the "Vendors and Entities" page:
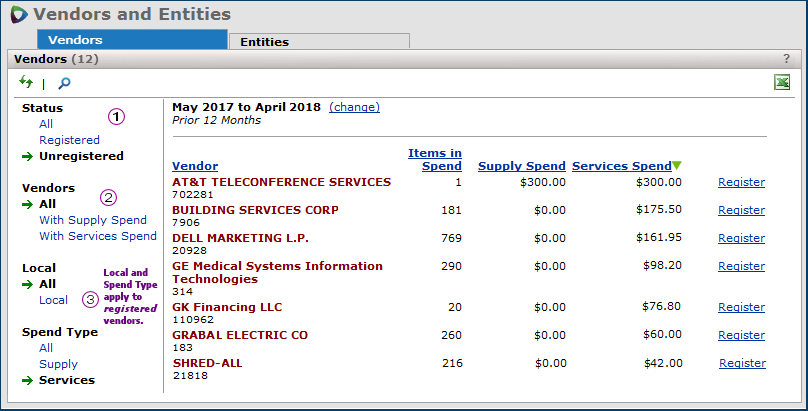
The Register link lets you look for an entity that the vendor belongs to, and register the vendor. If no entity exists for cross-referencing the vendor, and the vendor is local, you can define a new entity yourself. (If the vendor is not local, you can request the Help Desk to create a new entity.)
Details are in the topic Registering Vendors, or click the ? Help button.
View Invoice Spend with Missing Vendors - Lets you view spend on invoices for missing vendors. These vendors are missing from your data tables, not just unregistered. Links from the missing vendors list let you add and register vendors.
View Services Vendors - Displays a list of vendors whose spend type is services.
This feature is only available for sites with Sourcing and Contract Management and with the ERP - Materials Management and/or Accounts Payable applications.
Normally, spend dollars for analysis in Sourcing and Contract Management are drawn from the set of vendors labeled "MM and AP." These vendors produce both purchase order invoices and non-purchase order invoices.
Vendors labeled "AP-only" are not automatically included in the Sourcing and Contract Management spend pool because hospitals tend to have many such vendors that are small- volume suppliers or services providers, one-time vendors, or are set up as "AP-only" to handle refunds. However, you may have AP-only vendors with significant amounts of spend -- services vendors -- that you wish to analyze.
To include spend from AP-only vendors in Sourcing and Contract Management, you set a flag on the vendor record in Materials Management or Accounts Payable. The Vendor Edit panel.
Instructions are in the advanced vendors setup chapter -- Work with Vendor Information: Advanced -- for Materials Management and Accounts Payable.
Copyright © 2023 by Premier Inc. All rights reserved.