The supply Analysis Workbench provides tools for segmenting supply spend dollars for analysis. You can examine file, non-file, and off-contract spend individually. You can also work with all spend. The analysis tools provide actual spend data from the past 12 months.
If you are working with services contract spend, see "Examining Services Spend."
Customers have the option of enabling/disabling the Supply Analysis feature as part of their SCM package. This feature is initally enabled by default.
When this feature is disabled, users cannot work with supply spend data and analytics. The SCM main menu does not provide a Supply Analysis element. Also, when this feature is disabled, any supply analytics gauges, such as these below are not available:
Contact the Help Desk or your Premier Consultant to enable or disable this feature.
The role object "CAAnalysis" controls access to this feature. To display the Analysis Workbench, the minimum setting must be View. For details about the settings required for the activities within the Analysis Workbench, see Role objects associated with Sourcing and Contract Management.
The analysis tools create dynamic analysis groups that segment a hospital's total (supply) spend dollars according to descriptors that the analyst selects. For example, a supply analysis group might contain spend data for...
...a certain type of item (e.g., sutures)
...from a specified manufacturer
...issued to particular organizations.
Put together, the descriptors "item keyword, manufacturer, and department " identify a segment of spend data -- an analysis group.
An analysis group is fluid: you can "slice and dice" the spend by changing, adding, or deleting spend areas. For example, you may wish to know how much of your spend on stents is on-contract and how much is off-contract. Which manufacturers account for the highest percent of spend on gloves? When you define an analysis group, you can save the group for future work in a project.
You can use an analysis group in an analysis project to compare prices to bring in benchmark data, and create requests for proposals. You can then compare prices among existing contracts, contract tiers, benchmark values, and returned bids from manufacturers for the items in the analysis group. For example, you may wish to compare spend for an item type (identified by an UNSPSC code), purchased by several regions/organizations, but on different manufacturer contracts. In this case, you would create an analysis group for the item type and organizations. Then, you could compare spend data across the contracts. You might also request manufacturer bids for new prices, compare the bids, and award a new contract to the bid with the best prices. Once a contract is awarded, you can track contract savings. A project lets you do all of these things from within Sourcing and Contract Management.
The Vendor Spend section of the Product Index Layer documentation discusses vendor spend in detail. Here are key points about spend:
The Services Analysis Workbench lets you work with services spend. For details on working with services spend, see Examining Services Spend.
Other elements of spend, such as file spend, non-file spend, matched spend, etc. are outlined in detail in the table Spend and Savings Definitions.
Suggestion: Read the discussion of spend and savings definitions and keep it open for reference as you go through this topic.
For sites that use both 's Sourcing and Contract Management and Materials Management together: In the application's Item Catalog, it is possible to mark an item as "inactive." Spend for any item marked "inactive" in the Item Catalog is included in any analysis group that contains the item, and in Total spend for All Items on the Analysis Workbench.
Items deleted from the item record file are not included in spend.
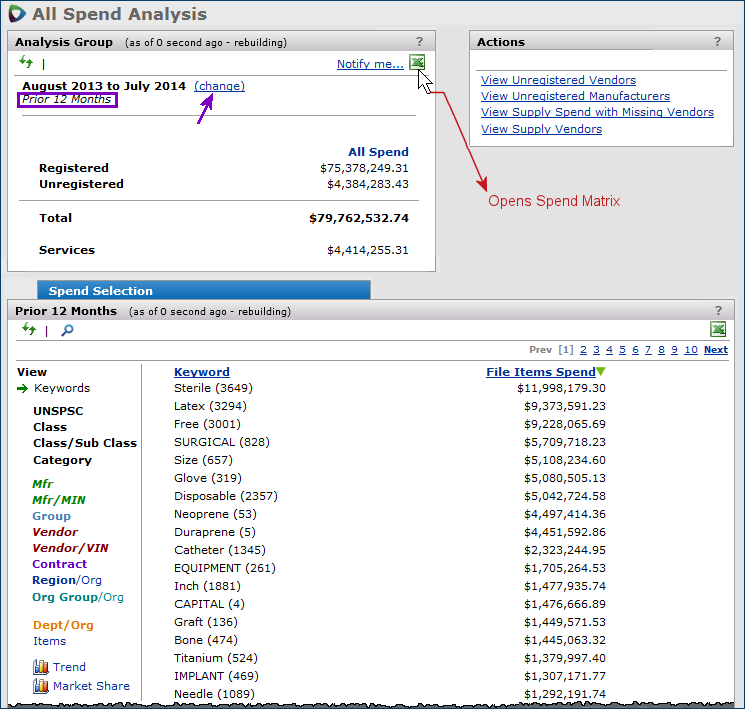
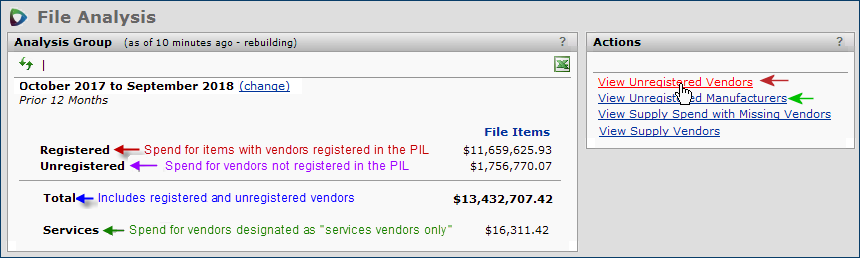
Figure 1 is the "All Spend Analysis" page. (If you selected another item type, the page name would reflect it; e.g., "File Analysis, Non-File Analysis," etc.)
The Analysis Group panel displays the default view of spend. If you select File Analysis, Non-File Analysis, or Off-Contract Analysis, the panel would display all spend for the selected item type: file, non-file, or off-contract items.
The Analysis Group panel initially displays the total actual supply spend dollars from the previous twelve months (Figure 1, top, left, purple box).
The prior 12 months is the default, but you can change the time period. You can specify any date range for which you have supply spend history.
Services spend is displayed on the Analysis Group panel for supply contracts, but not included in the Total.
To work with services spend, open the services Analysis Workbench.
Spend for unregistered vendors is included in Total spend, but not in spend for any analysis group that you create. In other words:
- When no analysis group has been defined, All Spend includes both registered and unregistered spend.
-
When an analysis group has been defined, All Spend includes only registered spend.
Unregistered vendor spend also contains the prior 12 months of spend for any missing vendors.
When you create an analysis group by identifying spend segments, this panel displays spend for the analysis group.
![]() The Actions panel contains activities that you can perform with the analysis group.
The Actions panel contains activities that you can perform with the analysis group.
Note: For off-contract analysis, the link Show Matching Contracts is not available. The Actions panel contains links for viewing unregistered and missing vendors.
![]() The Prior X Months panel (Figure 1, bottom) shows spend organized according to the Views on the left, and for the time period that you set on the Analysis Group panel (by clicking change).
The Prior X Months panel (Figure 1, bottom) shows spend organized according to the Views on the left, and for the time period that you set on the Analysis Group panel (by clicking change).
- On the left, Views — such as Keywords, Mfr, Class, etc. — organize spend into different areas. The default view displays spend by keyword.
- Use the Views and the search tool ![]() on this panel to identify a segment of spend, and save it as an "analysis group."
on this panel to identify a segment of spend, and save it as an "analysis group."
Opening the Excel Spend Matrix (Figure 2) is a good way to start your review of spend. The Spend Matrix can help identify areas where you may wish to focus your initial efforts.
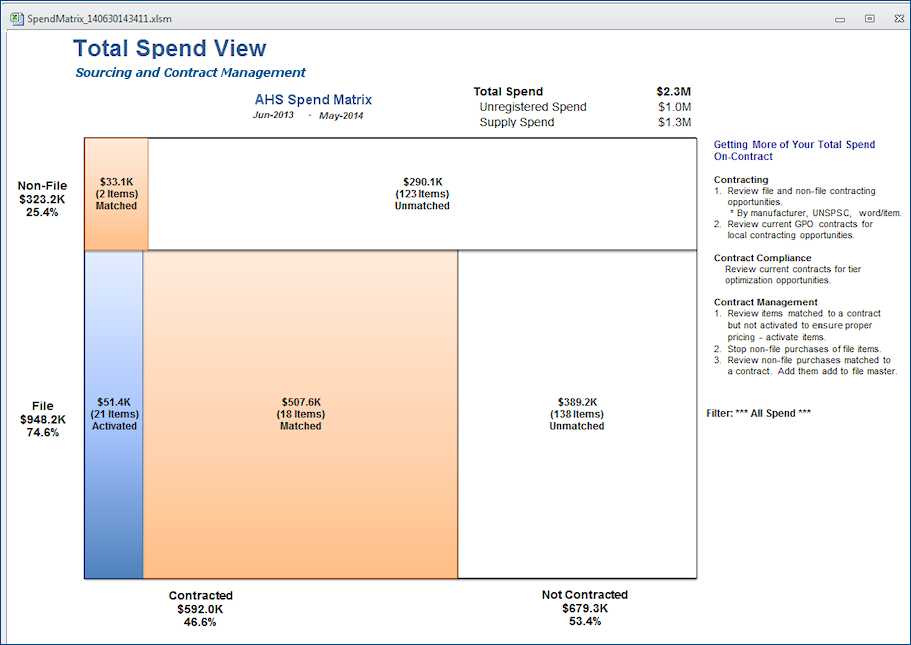
On the spend matrix, notice that non-file and file spend are organized vertically on the left.
The horizontal rows contain spend dollars for matched and unmatched items. Additionally, file spend contains dollars for activated items: items whose prices are activated on contracts and are being purchased at the contract prices.
When you click the Excel icon on the Analysis Group panel, the application may need to rebuild the data for the Spend Matrix. Since rebuilding can take a few minutes, you have the option of receiving an email message when the Spend Matrix is ready to view.
On the Spend Matrix, some tips are on the right. Applying those tips to the data in Figure 2, results in these areas for investigation.
Note: Sourcing and Contract Management displays savings opportunities and tracks recovered savings as you work with suppliers to recoup overpayments.
Segmenting spend into analysis groups helps you identify areas where you may have recoverable overpayments, or where you may wish to change your purchasing practices to achieve savings.
On the Sourcing and Contract Management main Contents (Supplies tab), click Analysis Workbench.
Select either Off-Contract Analysis, File Analysis, Non-File Analysis, or All Spend Analysis.
A panel appears for the spend type. For example, Figure 1 displays all spend.
Accept the twelve months default time frame for the spend, or select a new time frame.
To change the timeframe, on the Analysis Group panel, next to the default dates, click change (Figure 3).
For example, you could select Mfr to organize the spend by manufacturer entity.
Table 1 is a summary of how to organize spend using the different descriptors. In the table,
- The top rows explain categories that you can select to define analysis groups.
- The bottom rows explain categories that display spend in detail in an analysis group that you have defined (or for all spend).
For each descriptor, clicking the search icon ![]() helps you locate a particular element. For example, clicking UNSPSC organizes spend by UNSPSC code. Clicking
helps you locate a particular element. For example, clicking UNSPSC organizes spend by UNSPSC code. Clicking ![]() opens a search box so that you can look for a particular UNSPSC code.
opens a search box so that you can look for a particular UNSPSC code.
| To select spend by... | Click this descriptor... |
| Descriptions of items and item record fields |
Keywords
This view is the default. The list displays keywords derived from descriptions of items and from values in item record fields (such as Item Alias). Next to each keyword is the number of items (in parentheses), and the 12-month spend. Desc: Does not function. |
| UNSPSC-coded items | UNSPSC - A list of UNSPSC codes for items that have spend appears. - The number of matched items with each UNSPSC code appears in parentheses next to the code. - Spend dollars for items with each UNSPSC code is displayed. Desc: On displays UNSPSC code descriptions. |
| item class Not available for non-file analysis. |
Class - A list of item classes with spend. For items with item file/item catalog records, the system uses the item class from the item record. For non-file items, the system looks for the item class in the most recent spend transaction for each item. If present, the item class is then displayed. - The number of items in each class is in parentheses. - The list is organized by spend, in descending order. You can re-sort columns with underlined column headers by clicking the column header. Desc: On displays the Item Class ID. |
| item class and subclass Not available for non-file analysis. |
Class/Sub Class (File items only)
- A list of item classes with spend and each associated subclass appears. Desc: On displays the Item Class ID and the Subclass ID. |
| category | Category For members, designates a Contract Category, and the number of items in the category. e.g., "Orthopedic Soft Goods." When the Item Master (PIM) is enabled - The system uses the category descriptor Unknown for spend that isn't matched to a item. - Spend that is matched to a item, but has not been assigned to a category will also appear in the Unknown category. |
| manufacturer entities | Mfr - A list of manufacturer entities that have spend dollars appears. - The spend amount and the parent entity for each manufacturer is displayed. - The number of matched items for each manufacturer and the parent is in parentheses. Desc: On displays manufacturer IDs. |
| manufacturer entities
and manufacturer item numbers (MINs) |
Mfr/MIN - Manufacturer item numbers that have spend dollars appear. - The spend amount for each item is displayed. Contract: - When an item is either matched or activated on a contract, the contract number is in purple text. - If specific security has been set for the contract, and the user is not authorized to view the contract, the contract number is in gray text. - If a contract is not a Sourcing and Contract Management contract — i.e., the contract originated in a site's MMIS system from another vendor — the text is black. - If multiple contracts (or contract Statuses) exist for an item MIN, the panel displays each line individually Status: This column displays either Matched or Activated, depending on whether the item price is activated Desc: On displays manufacturer item descriptions and manufacturer IDs. |
| analysis groups Note: Not available for non-file spend analysis. |
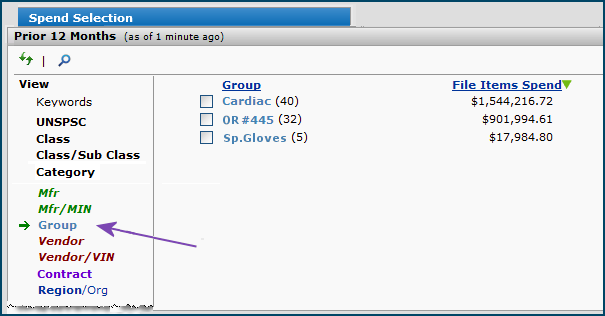
Group - For all items, any saved analysis groups with spend for the prior 12 months appear. - For a segment of spend that has been identified, any analysis groups that belong to the segment appear. For example, a user may have defined a new analysis group as a collection of three other analysis groups. - Spend data is displayed for each analysis group. - The number of matched items for each analysis group appears. Desc: Does not function. |
| vendor entities | Vendor
A list of vendor entities that have spend dollars appears. - The number of matched items for each vendor is in parentheses. Desc: On displays vendor buy-from location names and numbers. |
| vendor entities and item vendor numbers (VINs) |
Vendor/VIN Vendor item numbers that have spend dollars appear. Click any vendor entity name to display the entity family. Desc: On displays vendor item descriptions and vendor buy-from location names and numbers. |
| contracts Note: Not available for off-contract spend analysis. |
Contract - Contract numbers containing analysis group items with spend are displayed. - The number of items on each contract is displayed in parentheses. Desc: On displays part of the contract name. |
| regions and organizations | Region/Org
- The list of regions/organizations with spend appears. - Spend for each region/organization is displayed. - Total spend for all regions appears in bold. Desc: On displays the region and organization names. Note: The spend categories that you select to create an analysis group appear on the Analysis Group panel. On the Analysis Group panel, you can remove spend for a category (or "undefine" the analysis group altogether) by clicking a category's selection box. An exception is Region/Org. When the Region/Org category appears with its spend on the Analysis Group panel, you cannot un-select it there to undefine the group. You must go back to the Prior 12 Months Spend panel to un-select Region/Org. |
| organization group and organizations in the group |
Org Group/Org Desc: On displays the organization groups and organization names, and their associated spend dollars. The Org Group/Org category segments spend by organization group and organizations in the group. If you select an organization group, you must also select another descriptor -- UNSPSC, Class/SubClass, Category (if relevant at your site),Mfr, Mfr/MIN, Contract, etc. -- to create an analysis group. The analysis group then contains spend for the particular organization group(s) in the categories (e.g., Mfr) that you chose. Notes: - On the Analysis Group panel, you can remove spend for a category . (or "undefine" the analysis group altogether) by clicking a category's selection box. An exception is Org Group/Org. When the Org Group/Org category appears with its spend on the Analysis Group panel, you cannot un-select it there to undefine the group. You must go back to the Prior 12 Months Spend panel to un-select Org Group/Org. - Organization groups are defined in the Administration tables. Once you define an organization group, you can assign organizations at your site to the group. For details on setting up organization groups, see Grouping Organizations. - The organizations that you can work with are listed in your Data Profile. |
| To display spend by... | Click this descriptor... |
| departments by organization | Dept/Org Desc: On displays department and organization names. |
| individual items | Items Select All Items, Matched items, Unmatched items, or Activated items. Desc: On displays item descriptions. |
![]() Spend item counts
Spend item counts
A number appears in parentheses for each element in a spend segment, based on the view. For example, in Contract view, a list of contracts with spend appears. Each contract number is followed by a count in parentheses which indicates the number of items on the contract contributing to the spend. Similarly, in Class view, each class with spend contains a count of items in parentheses that contributed to the spend.
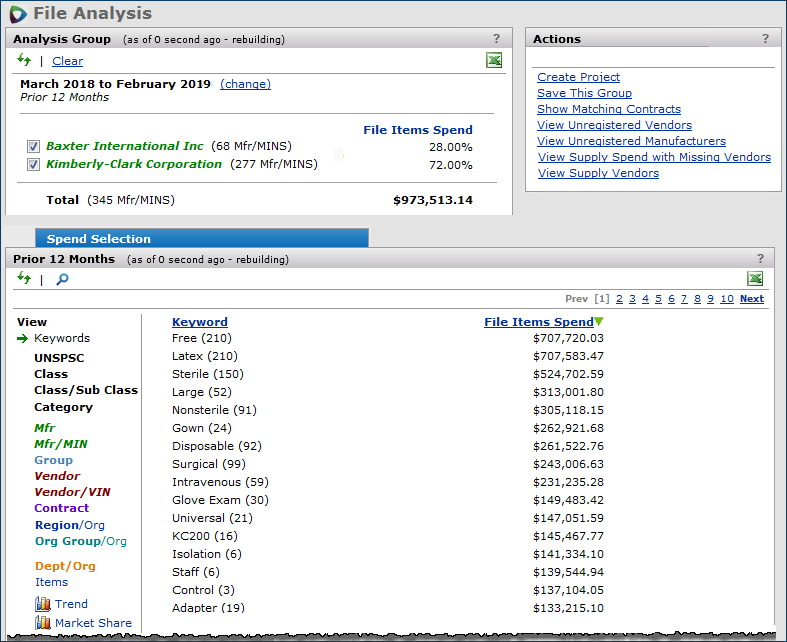
Figure 4 is an analysis group built from file item data. (You could segment the spend differently to define many other analysis groups from the total file item spend dollars.)
The Analysis Group panel (Figure 4, top) displays an analysis group containing file item spend from two manufacturers -- Baxter and Kimberly Clark.
The Prior 12 Months panel in Figure 4 includes spend for items with several keywords (although these keywords were not selected to define the group). The spend includes items with the Keywords "Free," "Latex," "Sterile", "Large," "Nonsterile," and others.
The total spend for the analysis group items is $973,513.14. This value represents 345 items with unique manufacturer item numbers. The percentage of spend attributable to the manufacturer Baxter is 28.00; the percent attributable to Kimberly-Clark is 72.00.
The Dept/Org View (Figure 5) displays issue spend by departments for all spend, or for analysis group spend -- such as spend for a particular manufacturer entity, vendor, contract, item class, etc. Spend data by department is available for sites that have ´s Materials Management system, and for sites with a materials system from a different vendor.
The Dept/Org View cannot be used to create an analysis group; nor can Dept/Org spend be included in an analysis group. However, you can display departmental spend for an analysis group that you have created.
The report object "Department Issue Spend" allows you to generate a report of department spend. (For instructions on generating the report, see the documentation topic Create Custom Reports: To create a new report definition.) The report object lets users access both registered and unregistered spend. The Dept/Org view and the "Department Issue Spend" report object are sensitive to the user's data profile: only departments specified in the user's data profile are accessible
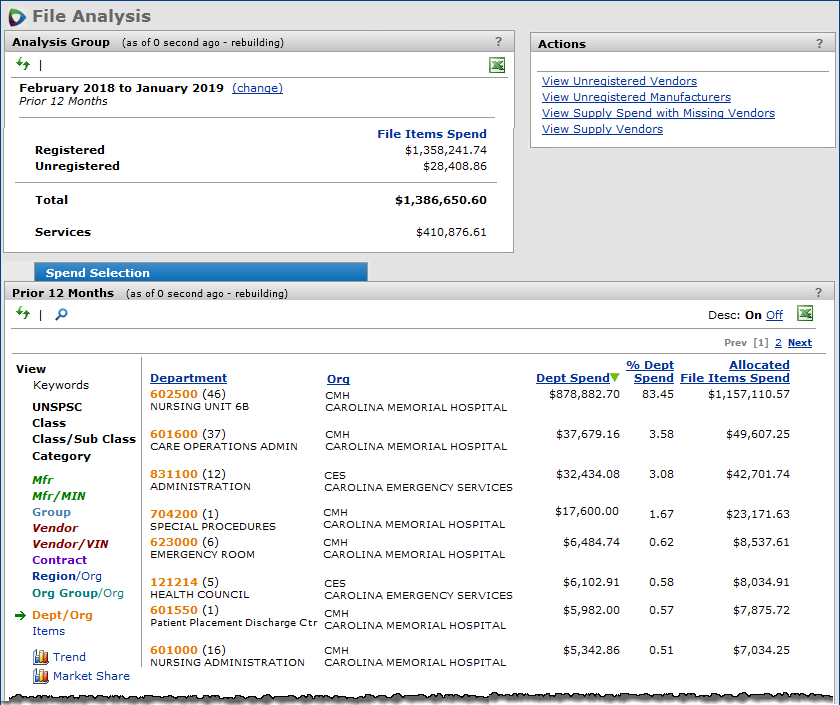
The Dept/Org view provides the following spend data:
Note: All Spend appears in the Analysis Group panel.
For Materials Management sites, departmental spend is automatically generated from a site's inventory transaction records.
Non-file department issue spend does not need to be associated with a purchase order.
The transactions used are below.
File item Transactions
Issue to Department
Cancel - Issue to Department
Cost Adjustment
Dept to Dept Transfer In
Dept to Dept Transfer Out
Department Cost Adjustment
Dept Return to Inventory
Non-file Item Transactions
Issue to Department
Cancel - Issue to Department
Cost Adjustment
Dept to Dept Transfer In
Dept to Dept Transfer Out
Department Cost Adjustment
Return to Vendor (non-file)
Generated spend is from "charge-to" departments.
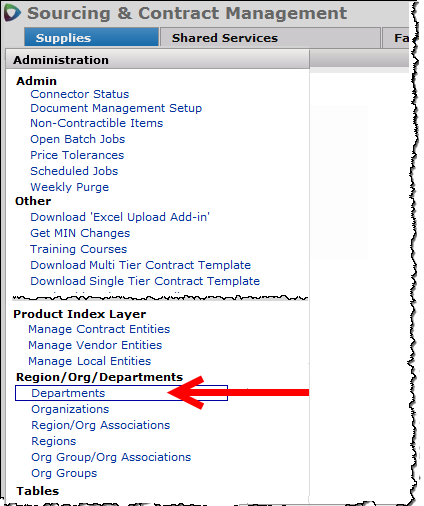
From the contents, a list of supply departments is located on the Administration menu under Region/Org/Departments (Figure 6). The departments listed in the table are governed by the user's data profile. Users with the appropriate data profile settings can display departments and edit department names. This list of departments is the same as those found in the Materials Management's Department list (Work in Materials > Requisitioning > Departments).
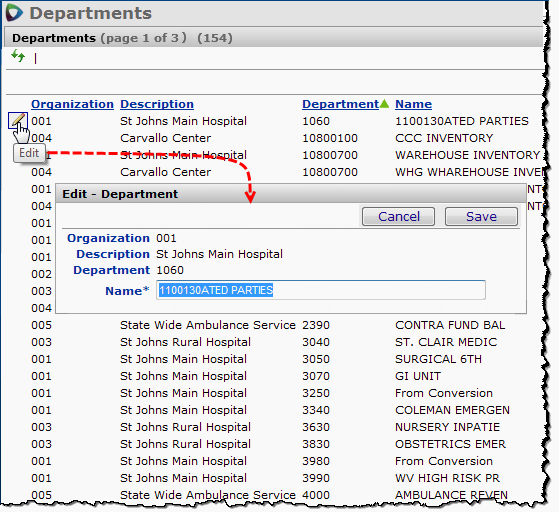
The supply Departments table (Figure 7) displays the supply departments in your Materials Management system (Main TOC > Materials > Requisitions > Departments) that are used to generate departmental spend data. You can edit department Names in this list if you have the necessary security settings.
Note: The role object "CADept" must be set to Modify or higher.
In generating departmental spend, if the system finds spend for charge-to departments that do not currently exist in the department table, it adds them to the table.
For sites with materials management systems from a vendor other than , setup is needed for departmental spend. Spend data is not available for other vendors' MMIS applications until it is generated via the setup process. Specifically, these tools are available:
- A CSV file specification for uploading inventory transaction data, including non-file items.
- Connectors — programs that feed data from an external system to Sourcing and Contract Management — are available.
Up to 24 months of spend can be uploaded to Sourcing and Contract Management initially. After the initial upload of spend data, sites can elect to provide spend data on a schedule, such as monthly.
Non-file item descriptions can be entered in the spreadsheet; the connector can handle them.
Sites with other vendors' materials management systems should contact the Help Desk for setup details.
When spend data is imported, Sourcing and Contract Management adds departments to the supply Department table (Figure 7). If your site uses an external materials management system (such as Lawson, PeopleSoft, or others), departments will not appear on this table unless you submit a feed of your departmental issue data in a .csv file to ´s applications. Departments that come from the feed contain From Department Issue Spend in the Name field, next to the department number. Users with the appropriate permissions can edit departments to change the Name values to reflect actual department names.
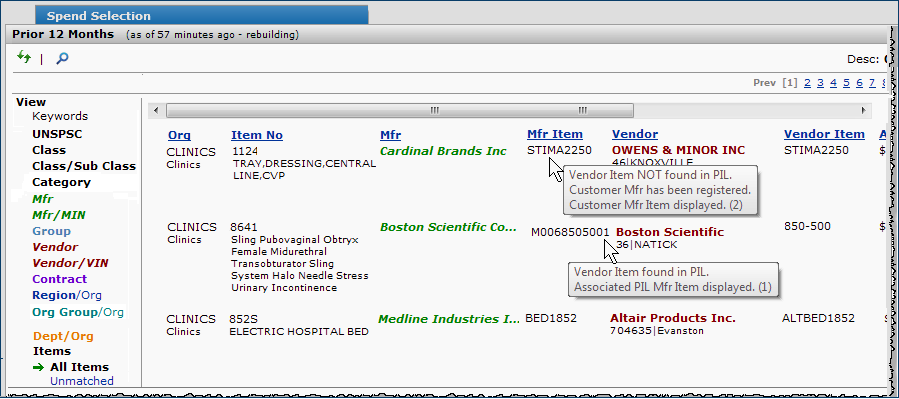
The Items view displays the Items list (Figure 8), which contains detailed item data for each analysis group (or for all spend). The Items view can filter data for all items, matched items, unmatched items, and activated items. (See the definitions document.) You cannot select items for analysis groups using the Items view.
In the Items list (Figure 8), mousing over the Mfr Item No for an item provides information about how the the PIL determined the manufacturer item number and vendor item number to use. This tool tip can helpful if you need to know the source of the displayed data.
Note: The tool tip is also available on the Items view in the Projects Contents panel.
The list of tool tip messages is below. See Identifying Items for Matching and Analysis in the Product Index Layer documentation for a more detailed explanation.
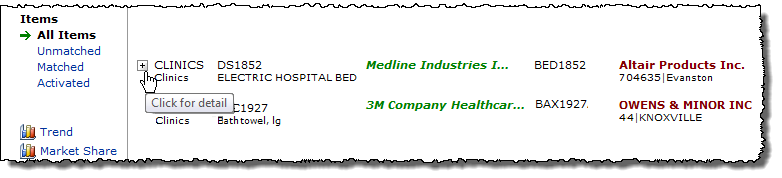
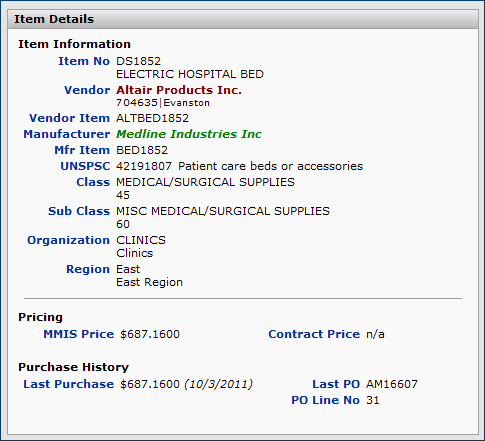
On the Items view, mousing over the Org value in an item row displays a "+" (Figure 9).
- Click the "+"
to display item information (Figure 10).
Note: On the Prior X Months panel, very rarely the system displays a spend category containing five or more descriptors grouped together. Usually, this situation occurs when the same Vendor Item Number was used over and over for different non-file items on POs. These multiple-line categories cannot be selected, and do not contain a selection box.
For the analysis group that appears in the Analysis Group panel, the Actions panel (Figure 4, top right) contains the link Show Matching Contracts.
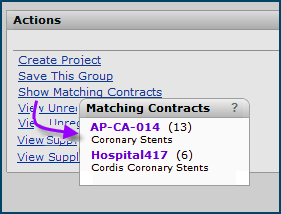
In parentheses next to the contract number is the number of analysis group items that match that contract. Under the contract number is the first part of the contract description.
The Prior X Months panel provides two graphs of spend over time. The Trend graph displays dollar amounts and percent spend by month for an analysis group or for all items by category: file, non-file, off contract, and all -- whichever you are currently working with. The Market Share graph displays spend for different manufacturers by month.
Figure 12 graphs the trend over the previous 12 months for the spend segment identified in the Analysis Group panel.
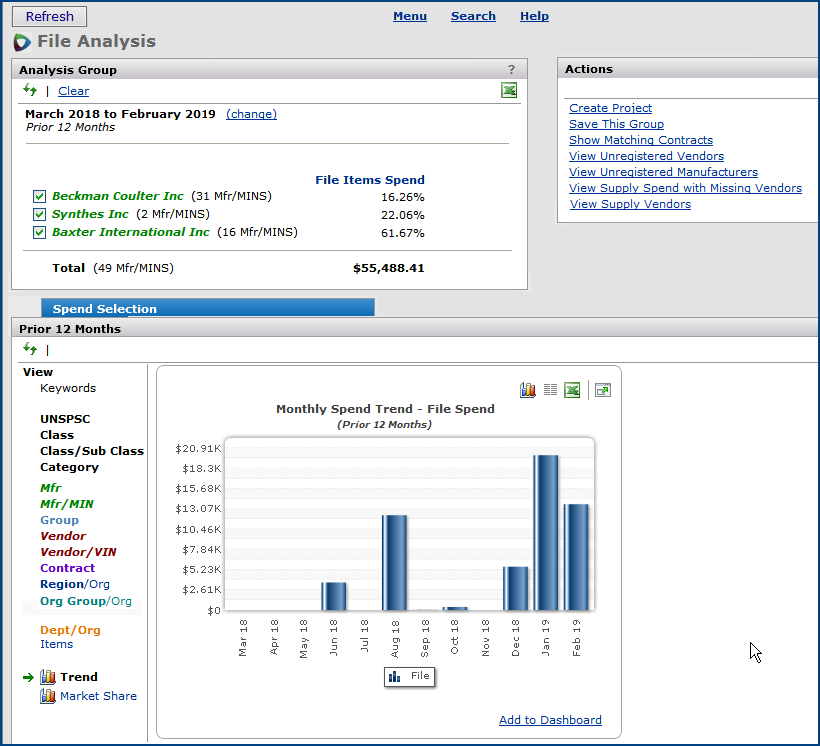
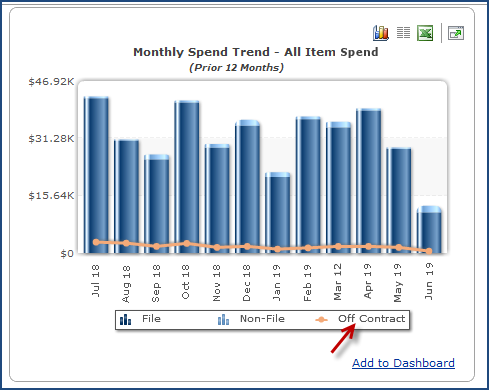
Figure 13A is an example of a graph for All spend. Note that the icons in the legend at the bottom of the graph are selectable. Clicking an icon toggles the display of the data on and off. Figure 13B is the result of clicking "Off Contract" for the graph in Figure 13A.
 |
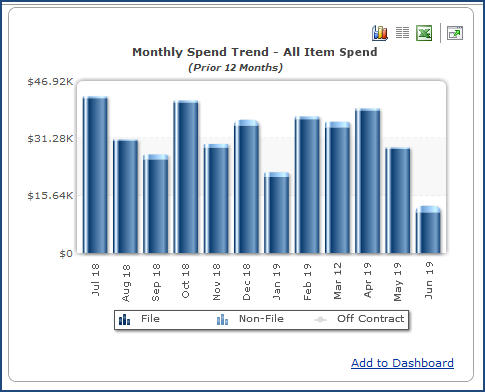 |
Figure 13A - Monthly Spend - All Items: |
Figure 13B - Monthly Spend - All Items: |
Figure 14 graphs manufacturer market share for an analysis group with spend from several manufacturers. The graph displays spend from the previous twelve months.
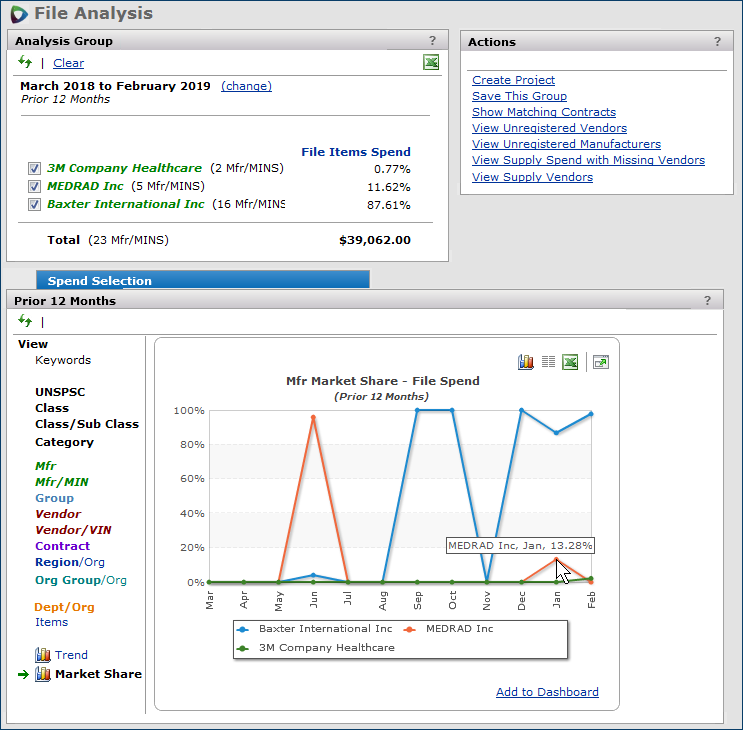
% Spend per month for a sub-group (e.g., Baxter) =
Spend per month for the sub-group (Baxter) / Total spend per month for all sub-groups (e.g., Baxter + 3M + Sprays & Washes, Inc.)
You can save analysis groups containing file, non-file, off-contract, and "all spend."
(One restriction exists. See the discussion below.)
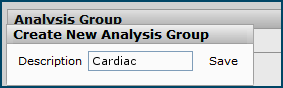
A prompt for the group name appears (Figure 15).
You can add items to a saved analysis group only when you are working in Projects.
On the Analysis Workbench panels, you can add items only to an unsaved analysis group.
When you segment spend into an analysis group for study, you will want to go further and solicit bids from suppliers to try to get better prices. With a few proposals in hand, you can compare prices, and award a contract to a supplier. These activities -- and more -- are available in the Projects feature.
Save your analysis group then create a project with the group. Open the project in the Projects area: main Contents > Projects.
(A restriction exists on creating a project from an analysis group. See the discussion below.)
A prompt for the project name appears (Figure 17).

Note: For details on enabling tabs, see the online documentation topic Setting Tabs. (This topic is on page three of the linked document.)
- From the main Contents (for Supplies), select Projects. The list of available projects appears.
- Click the project name to open it.
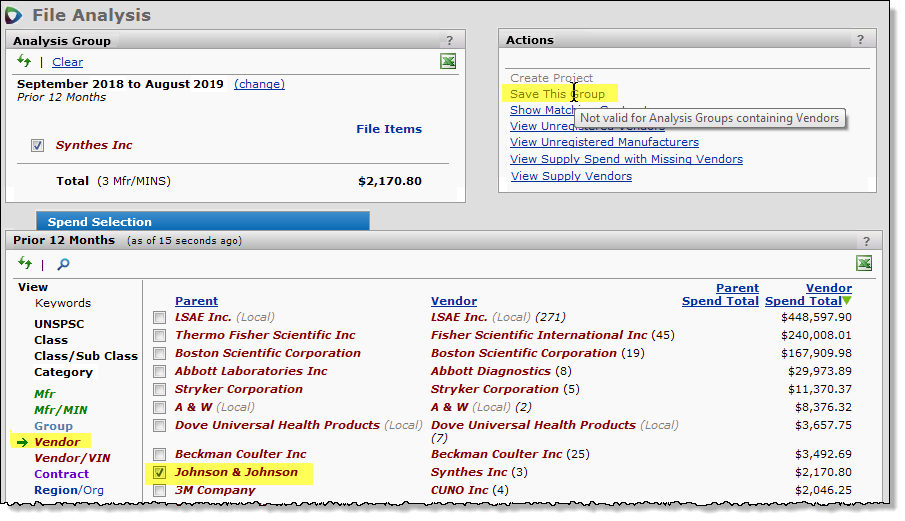
When a Vendor entity or Vendor/VIN is among the selection criteria, you cannot save analysis groups.
Also, for any type of analysis group (file, non-file, off-contract, or all), you cannot create a project when the analysis group's selector includes a Vendor entity or Vendor/VIN.
The Create Project and Save This Group links in the Actions panel are grayed out. Figure 18 is an example:
You can export an analysis group to an Excel Project Template spreadsheet, add non-spend items, edit items on the spreadsheet, and then upload the spreadsheet to create a new project. The spreadsheet is in the Project Template format.
Setup: Make sure that you have the Add-In for Excel spreadsheet uploading installed. Instructions are in the Setup section of the Analysis Projects.
Note: You can only use the spreadsheet method to create a new project. You cannot update an existing project with a spreadsheet. For example, you cannot add/delete items or change item values in an existing project using the spreadsheet.
![]() On the analysis workbench, identify the analysis group for the project (Figure 19).
On the analysis workbench, identify the analysis group for the project (Figure 19).
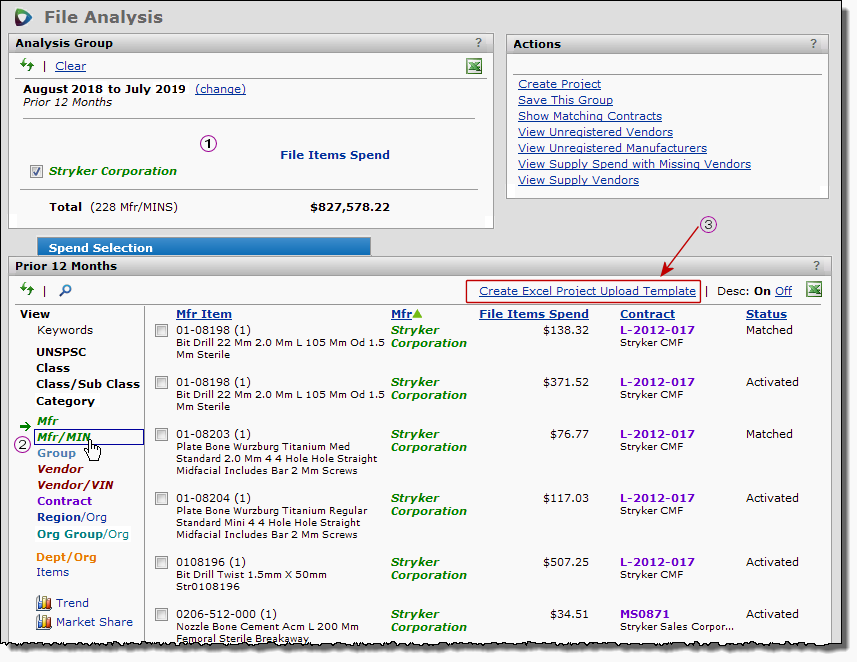
![]() Set the View to Mfr/MIN. (The download link
Set the View to Mfr/MIN. (The download link ![]() in the upper right only appears in this view.)
in the upper right only appears in this view.)
![]() Click the link Create Excel Project Upload Template in the upper right corner of the panel.
Click the link Create Excel Project Upload Template in the upper right corner of the panel.
The
Microsoft Windows File Download panel appears.
You can now open the file containing the spreadsheet to add non-spend items and project information. Detailed information about working with this type of project is in Working with Projects Created from the Project Template Spreadsheet.
You can change a vendor entity's spend type from "supply" to "services" using links on the Actions panel. (Services spend is available in the Services Analysis Workbench.)
Important: When you change the spend type of a vendor entity, the spend type of all the vendors registered to the entity is also changed.
Click the link View Supply Vendors on the Analysis Workbench Actions panel (Figure 20).

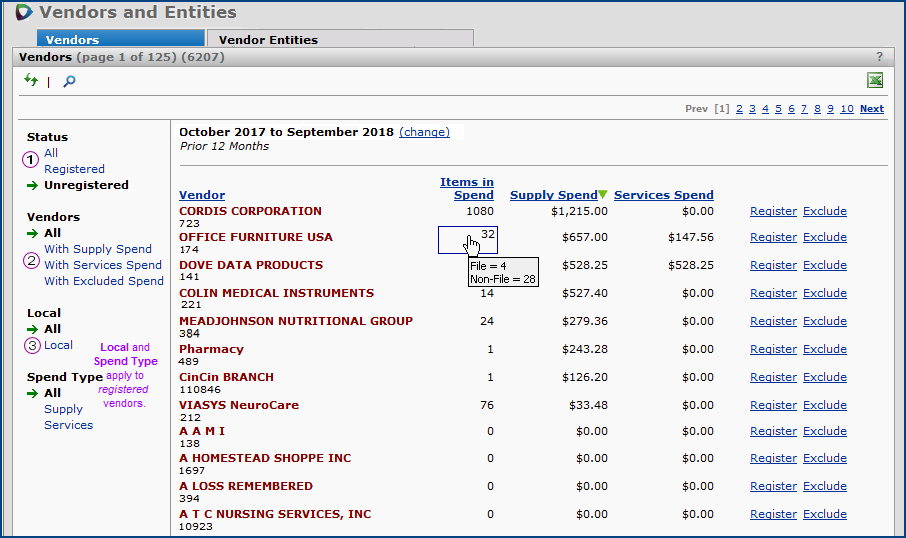
The list of vendors appears. (See Figure 21. The Vendor column is sorted in ascending order.)
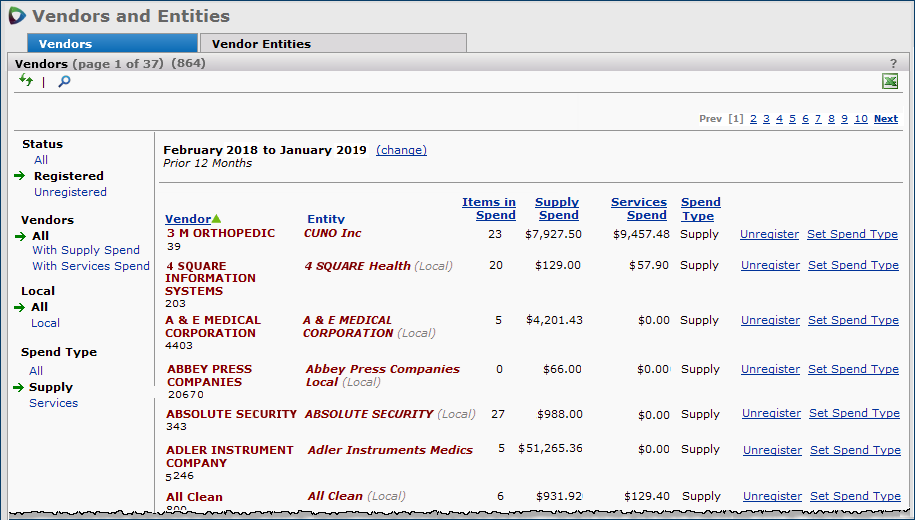
- Notice (Figure 21) Status displays Registered vendors. This setting is the default. You can change the Status setting to view All or Unregistered.
- Using the Vendors filter, you can display vendors only With Supply Spend, or only With Services Spend, or with both kinds (All).
- From the Local filter, you can select Local vendors only, or All vendors.
-
For Spend Type, the list defaults to Supply when you access it from the supply Analysis Workbench. You could switch the display to Services or to All (i.e., both) spend types.
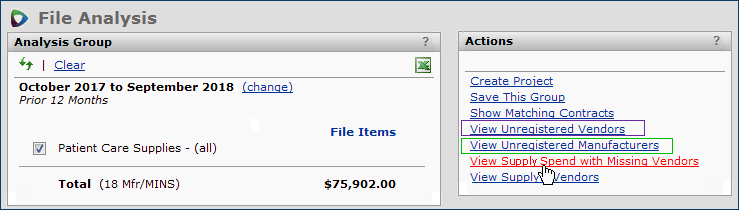
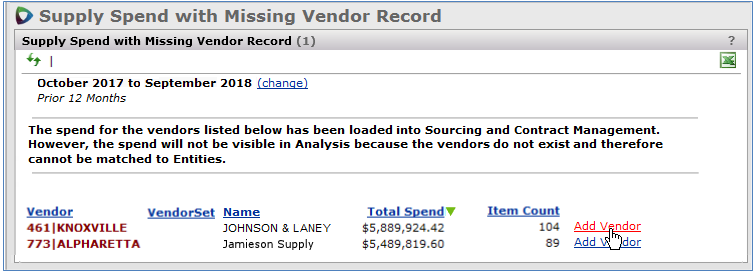
You may have spend for vendors that are missing from your data tables. You can view spend for these vendors from the Actions panel for an analysis group (Figure 21), or from a project's Add Items Actions panel.
Note: Unless your user role includes the "CARegistration" role object set to View, the links View Unregistered Vendors, View Unregistered Manufacturers, View Supply Spend with Missing Vendors, and View Services Vendors on the Analysis page Actions panel are grayed out. To work with vendor and manufacturer entities and registrations, this role object must be set to Modify, minimally.
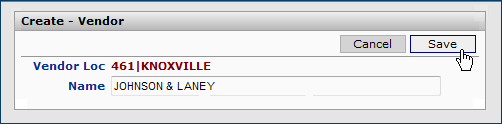
Spend for items from a missing vendor cannot be viewed on the Analysis Workbench. Adding and then registering the vendor to an entity makes spend for items from the vendor visible on the Analysis Workbench.
The Supply Spend with Missing Vendor Record panel appears (Figure 23):
If you have spend for unrecognized vendors, a list of the vendors and spend amounts appears (Figure 23).
Otherwise, a message explains that you have no missing vendor spend.
The default date range of spend is Prior 12 Months. However, this can be changed.
If you know that you have spend for a supply contract vendor or manufacturer, but the spend is not displayed (on the Prior 12 Months panel), the vendor or manufacturer may be unregistered. Spend for unregistered vendors and manufacturers is not available for analysis.
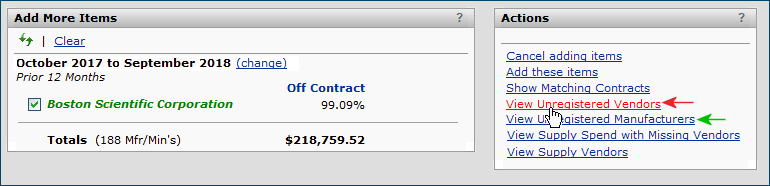
The Actions panel on the Analysis Workbench (Figure 25) page and the "Work with Project" page for adding items (Figure 25) each provide a shortcut for registering the vendors or manufacturers.
On the Actions panel link...
On the vendors list, you can...
You can also work with registered and unregistered vendors from the Administration menu.
On the "Vendors and Entities" page:

On the vendor Items panel, you can...
The links for registering a manufacturer are on the Actions panel of the "Analysis Workbench" page (Figure 25) and the "Work with Project" page (Figure 27).

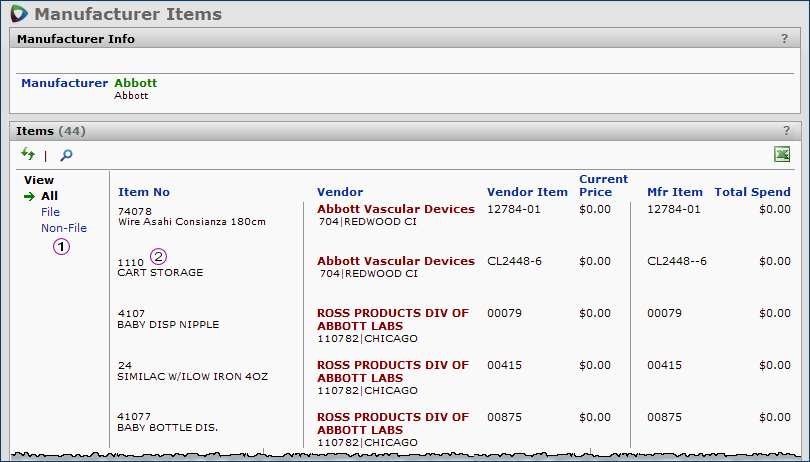
On the manufacturer Items panel, you can..
When spend exists for a non-file item ordered in different units of measure, and the system has no vendor buy-from location or vendor UOM for the item, the different units of measure are consolidated in reporting spend.
For example:
TruValu vendor item 846T was purchased within the last twelve months @ 5.00/EA and 25.00/CS. Sourcing and Contract Management contains no vendor buy-from or UOM information for this item VIN. To display spend for this item in Analysis and in Projects, the system consolidates the two purchase line amounts in different UOMs into a single value with a UOM of EA.
Copyright © 2023 by Premier Inc. All rights reserved.